
Key Takeaways
- The test turns one finishing time into an estimated VO₂max. Two published equations do it. One uses time alone[2]. The other, from George and colleagues, adds body mass and sex[1].
- Both are estimates, not measurements. A review of 123 studies put the 1.5-mile test at r = 0.79 against lab VO₂max, the highest of the distance tests[5].
- The George study measured 149 fit college students aged 18 to 29. Its 1.5-mile equation had a standard error of 2.8 ml/kg/min in the fitting group and 3.9 in cross-validation[1]. I found no published error for the time-only equation.
- This page shows both, plus where your time ranks for your age and sex. The two can differ by several points.
- The earlier version of this page borrowed the coefficients of a 1-mile jog equation, with age where a heart rate belongs. It gave 72.8 for a 30-year-old man of 75 kg running 12:30. That is removed.
How to Run the 1.5-Mile Test
A flat, measured course and one honest effort.
The distance is 1.5 miles, which is 2,414 m. On a standard 400 m track that is six laps plus about 14 m. The Cooper Institute treats it as interchangeable with the 12-minute run and says it is easier to run with a large group[2].
- Check you are apparently healthy and regularly active. For people who are obese, relatively inactive or often get joint pain while running or the next day, the Cooper Institute suggests a walking test such as the Rockport 1-mile walk instead[2].
- Skip a heavy meal for 2 to 3 hours, and warm up and stretch before the run[12].
- Run the distance as fast as you can, at a pace you can hold. The Cooper Institute calls starting too fast the common mistake in its 12-minute run, and the same logic applies here[2].
- Record your time to the second.
- Cool down by walking for about 5 minutes[12].
The Cooper Institute says the test can be done on a treadmill. When it is used for hiring, it says to use the same surface each time, track both times or treadmill both times[2].
The Two Equations and Where They Come From
Same run, two published routes to a VO₂max.
Time only. VO₂max = 483 ÷ time in minutes + 3.5. The Cooper Institute gives this formula for the 1.5-mile test[2]. I could not find a paper that derives it or reports its error.
One part is checkable. The 483 is 0.2 × 2,414 m (482.8), the horizontal term of the ACSM running equation, and 3.5 is one MET at rest[10]. The numbers line up, but I am not claiming that is where the Cooper Institute got it.
George 1993. Women: 88.020 − 0.1656 × weight (kg) − 2.767 × time (min). Men: add 3.716, which makes the starting figure 91.736.
The 1993 abstract confirms the three inputs and the fit, then cuts off before the coefficients[1]. I could not read the full paper. Two later papers print the same coefficients, and one of them credits George and colleagues[13][7].
A university lab manual prints 2.76 for the time coefficient[8]. That looks like rounding of 2.767, which is what I use. The effect is under 0.1 ml/kg/min at 12 minutes.
Worked example: same run, two answers
Body mass is the reason. The time-only formula gives the same answer to a light and a heavy runner with the same time. George subtracts 0.1656 for every kilogram.
I cannot tell you which is closer to your lab value. If you are fit and aged 18 to 29, the George equation has the better documented error. Outside that group, treat both as rough and use the same one each time you retest.
1.5-Mile Time to VO₂max Chart
The time-only equation, worked out for common finish times.
This chart uses the time-only formula, so weight and sex do not change it. Use the calculator for the George figure.
| 1.5-mile time | Pace per mile | VO₂max (ml/kg/min) |
|---|---|---|
| 8:00 | 5:20 | 63.9 |
| 9:00 | 6:00 | 57.2 |
| 10:00 | 6:40 | 51.8 |
| 11:00 | 7:20 | 47.4 |
| 12:00 | 8:00 | 43.8 |
| 13:00 | 8:40 | 40.7 |
| 14:00 | 9:20 | 38.0 |
| 15:00 | 10:00 | 35.7 |
| 16:00 | 10:40 | 33.7 |
| 17:00 | 11:20 | 31.9 |
| 18:00 | 12:00 | 30.3 |
| 19:00 | 12:40 | 28.9 |
| 20:00 | 13:20 | 27.6 |
Estimated VO2max from the time-only equation for 1.5-mile finish times
1.5-Mile Run Times by Age and Sex
Where a time ranks, in percentiles.
Each cell is the time at or under which you reach that category. Superior is the 95th percentile or better. Excellent is 80 to 94, Good 60 to 79, Fair 40 to 59, Poor 20 to 39, and Very Poor is below 20.
| Group | Superior | Excellent | Good | Fair | Poor |
|---|---|---|---|---|---|
| Men 20-29 | ≤ 9:10 | ≤ 10:08 | ≤ 11:27 | ≤ 12:29 | ≤ 13:58 |
| Men 30-39 | ≤ 9:31 | ≤ 10:38 | ≤ 11:49 | ≤ 12:53 | ≤ 14:33 |
| Men 40-49 | ≤ 9:47 | ≤ 11:09 | ≤ 12:25 | ≤ 13:50 | ≤ 15:32 |
| Men 50-59 | ≤ 10:27 | ≤ 12:08 | ≤ 13:53 | ≤ 15:14 | ≤ 17:30 |
| Men 60-69 | ≤ 11:20 | ≤ 13:25 | ≤ 15:20 | ≤ 17:19 | ≤ 20:13 |
| Women 20-29 | ≤ 10:20 | ≤ 11:56 | ≤ 13:25 | ≤ 15:05 | ≤ 17:11 |
| Women 30-39 | ≤ 11:08 | ≤ 12:53 | ≤ 14:33 | ≤ 15:56 | ≤ 18:18 |
| Women 40-49 | ≤ 11:35 | ≤ 13:38 | ≤ 15:17 | ≤ 17:11 | ≤ 19:43 |
| Women 50-59 | ≤ 13:16 | ≤ 15:14 | ≤ 17:19 | ≤ 19:10 | ≤ 21:57 |
| Women 60-69 | ≤ 14:28 | ≤ 16:46 | ≤ 18:52 | ≤ 20:55 | ≤ 23:55 |
1.5-mile run: time needed for each category
These come from a law-enforcement scoring sheet published by a test-prep company, which does not state its sample or how it was built[9].
Its Excellent, Good, Fair and Poor times match the Cooper Institute 2009 table as reprinted in a university lab manual[8]. That reprint has no 95th percentile column, so I could not check the Superior times.
The site that tabulates the sheet reports that its times differ from the Cooper Institute's 2013 monograph in 58 of 60 cells[9]. I could not check the monograph myself. Treat the categories as a guide to how you compare, not a pass mark, and not as a description of the general public.
The same table scores the run inside the Physical Fitness Test calculator, alongside push-ups, sit-ups and reach.
How Far to Trust the Number
Good for tracking yourself, not a lab result.
| Study | Who | Finding |
|---|---|---|
| George 1993[1] | 149 fit students aged 18 to 29. The 1.5-mile model used 49 in the fitting group and 47 in cross-validation | Fitting group: adjusted r = 0.9, error 2.8. Cross-validation: adjusted r = 0.82, error 3.9 |
| McNaughton 1998[4] | 32 young men, active to trained | r = 0.87 with measured VO₂max |
| Mayorga-Vega 2016[5] | Meta-analysis of 123 studies and 200 correlations across all walk/run tests, in apparently healthy children and adults | 1.5 mile pooled r = 0.79 (95% CI 0.73 to 0.85), the highest of the distance tests |
| Castro-Piñero 2021[6] | Review, adults aged 19 to 64 | Strong evidence the 1.5-mile test is valid for estimating cardiorespiratory fitness |
Studies behind the 1.5-mile run as a fitness estimate
Error is in ml/kg/min. A correlation tells you the test ranks people well, not that your own estimate is close. The George equation's cross-validated standard error of 3.9 is the figure to keep in mind for any single result. If errors are roughly normal, about one result in three falls outside one standard error.
The meta-analysis found that sex, age and VO₂max level did not seem to change how well the walk/run tests track lab results[5]. That is about correlation, not about the size of the error for any one person.
A university lab manual lists pacing, motivation, weather and terrain as things that affect the result[8]. I found no validated correction for them, so none is applied. For tracking, repeat the test on the same course in similar conditions.
Limits and What Is Left Out
What this page does not claim.
- It is not a diagnosis. The Cooper Institute describes the test as for apparently healthy, regularly active people[2]. A maximal run is hard exercise, so anyone with heart disease or symptoms on exertion should ask a doctor first.
- The percentile table ranks your time, not your VO₂max. For VO₂max itself, the FRIEND registry published updated US reference percentiles in 2022, from 22,379 lab tests[14]. I have not reproduced those tables here.
- The earlier page's fitness cutoffs, its population-average equations and its pace-from-VO₂max equation are gone. None had a source I could find.
- There is no altitude or heat correction and no pass or fail line for any employer. Standards for those jobs differ and change.
- If you cannot run flat out, a submaximal 1.5-mile walk, jog or run test exists, built on 101 college students with an error of 3.37[11]. It uses a different equation and is not offered here.
For related tools, try the Fitness Age calculator, the Magic Mile calculator or Zone 2 Heart Rate Calculator.
Frequently Asked Questions
Sources & References
- VO2max estimation from a submaximal 1-mile track jog for fit college-age individuals. George JD, Vehrs PR, Allsen PE, Fellingham GW, Fisher AG. Medicine & Science in Sports & Exercise 25(3):401-406 (abstract) (1993)
- 50 Years of the Cooper 12-Minute Run. The Cooper Institute. cooperinstitute.org (blog post)
- A means of assessing maximal oxygen intake. Cooper KH. JAMA 203(3):201-204 (cited for the 12-minute run; sample and correlation as described in source 2) (1968)
- Validation of several methods of estimating maximal oxygen uptake in young men. McNaughton L, Hall P, Cooley D. Perceptual and Motor Skills 87(2):575-584 (1998)
- Criterion-related validity of the distance- and time-based walk/run field tests for estimating cardiorespiratory fitness: a systematic review and meta-analysis. Mayorga-Vega D, Bocanegra-Parrilla R, Ornelas M, Viciana J. PLoS One 11(3):e0151671 (2016)
- Criterion-related validity of field-based fitness tests in adults: a systematic review. Castro-Piñero J, Marin-Jimenez N, Fernandez-Santos JR, Martin-Acosta F, Segura-Jimenez V, Izquierdo-Gomez R, Ruiz JR, Cuenca-Garcia M. Journal of Clinical Medicine 10(16):3743 (2021)
- Multiple fitness improvements found after 6-months of high intensity functional training. Cosgrove SJ, Crawford DA, Heinrich KM. Sports (Basel) 7(9):203 (prints the 1.5-mile equations in its methods; credits Cooper 1968) (2019)
- Cooper 1.5 Mile Run/Walk Assessment (Lab 3.1). De Anza College, Fit Happens lab compendium (adapted from The Cooper Institute, 2009). Medicine LibreTexts
- 1.5-Mile Run Norms by Age & Sex. FitnessNorms. fitnessnorms.com (describes the CCS Cooper Standards sheet)
- Metabolic calculations in action: part 2 (running equation, Box 1). Bushman BA. ACSM's Health & Fitness Journal 24(4) (2020)
- Prediction of maximum oxygen consumption from walking, jogging, or running. Larsen GE, George JD, Alexander JL, Fellingham GW, Aldana SG, Parcell AC. Research Quarterly for Exercise and Sport 73(1):66-72 (2002)
- 1.5 Mile Run: protocol. Indiana Law Enforcement Academy. in.gov/ilea physical fitness standards
- Relationship between the 20-m multistage fitness test and 2.4-km run in law enforcement recruits (prints the George 1.5-mile equations). Lockie RG, Dawes JJ, Moreno MR, Cesario KA, Balfany K, Stierli M, Dulla JM, Orr RM. Journal of Strength and Conditioning Research 35(10):2756-2761 (2021)
- Updated reference standards for cardiorespiratory fitness measured with cardiopulmonary exercise testing: data from the Fitness Registry and the Importance of Exercise National Database (FRIEND). Kaminsky LA, Arena R, Myers J, Peterman JE, Bonikowske AR, Harber MP, Medina Inojosa JR, Lavie CJ, Squires RW. Mayo Clinic Proceedings (abstract) (2022)

Certified Personal Trainer & Sports Nutritionist
NASM-certified fitness and nutrition coach with over 10 years of hands-on experience helping people build strength, lose fat, and live healthier lives. Specializing in gym-based workouts with a strong focus on lifting technique, biomechanics, and practical exercise science. Through FitLifeRegime, sharing the tools, tips, and insights that have worked for hundreds of clients — helping you start your own fitness journey with confidence and clarity.
Learn more about Manish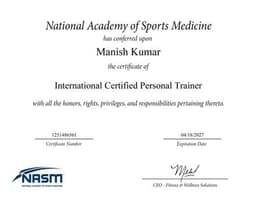
NASM Certified
Certified Personal Trainer & Sports Nutritionist from the National Academy of Sports Medicine
Disclaimer: This calculator is for informational and personal journaling purposes only. It logs measurements and compares them to published reference values. It is not health, medical, or nutrition advice.