
Key Takeaways
- Your squat to deadlift ratio is your squat 1RM divided by your deadlift 1RM. 180 kg over 220 kg is 0.818, or 81.8%. Flip it, deadlift over squat, and the same pair gives 122.2%.
- Among 1,368 Australian powerlifting competitors in 2017, the deadlift averaged 116.1% of the squat for men and 121% for women[1]. Turned around, the squat was about 86.1% of the deadlift for men and 82.6% for women (my arithmetic).
- I couldn't find a source for an ideal or healthy ratio, or one that links the ratio to muscle imbalance or injury. So this page compares you with an average and doesn't grade you.
- The ratio shifts with body mass. In heavier weight classes the squat gets closer to the deadlift[2][3].
- If you enter sets instead of tested 1RMs, your 1RMs are estimates. In one study the equations ran low, and ran lower for the deadlift than the squat[6], so a ratio built from sets can read higher than a tested one.
What the Squat to Deadlift Ratio Is
It compares the heaviest single you can squat with the heaviest single you can deadlift. Divide the squat by the deadlift and you get the squat to deadlift ratio. Divide the deadlift by the squat and you get the deadlift to squat ratio, which is its inverse.
Worked example: 180 kg squat, 220 kg deadlift
Squat ÷ deadlift = 180 ÷ 220 = 0.818
Deadlift ÷ squat = 220 ÷ 180 = 1.222
The ratio has no unit, so kilograms and pounds give the same answer. The table shows both directions side by side.
| Squat ÷ deadlift | Squat as % of deadlift | Deadlift as % of squat |
|---|---|---|
| 0.70 | 70% | 142.9% |
| 0.75 | 75% | 133.3% |
| 0.80 | 80% | 125% |
| 0.85 | 85% | 117.6% |
| 0.90 | 90% | 111.1% |
| 0.95 | 95% | 105.3% |
| 1.00 | 100% | 100% |
Squat over deadlift, and its inverse.
How the Calculator Works
What happens when you press Calculate
- A lift entered with 1 rep is used as your 1RM.
- A lift entered with 2 to 10 reps is turned into a 1RM by seven published equations[6].
- Your squat 1RM is divided by your deadlift 1RM, once for each equation, and the page shows the average and the range.
- The result is compared with the competition averages, and the weight gap is worked out from your own lifts.
If both lifts use the same reps, every equation gives the same ratio, because the rep factor cancels out. The equations then only change the 1RM figures. They affect the ratio when the reps differ, or when only one lift is a set.
Sets stop at 10 reps. The equations were built on sets of 10 reps or fewer[6]. Reynolds and colleagues, who tested the leg press and chest press rather than the squat and deadlift, advise no more than 10 reps in linear equations[7]. I have no source that supports the numbers beyond that.
What Competition Data Shows
The best source I found is a 2018 analysis of Powerlifting Australia results from January to November 2017: 1,368 individuals, 850 men and 518 women, aged 15 to 78[1]. It used each lifter's highest successful lift, as a multiple of bodyweight. It also states the deadlift as a percent of the squat.
| Group | Squat (× bodyweight) | Deadlift (× bodyweight) | Deadlift % of squat | Squat % of deadlift |
|---|---|---|---|---|
| Men (n = 850) | 2.23 ± 0.50 | 2.59 ± 0.53 | 116.1% | 86.1% |
| Women (n = 518) | 1.67 ± 0.40 | 2.02 ± 0.46 | 121% | 82.6% |
Latella et al. (2018), group means. The last column is my arithmetic from the reported percentage.
The percentages match the ratio of the two mean multiples (2.59 ÷ 2.23 = 1.161 and 2.02 ÷ 1.67 = 1.210), so they are ratios of group means. I found no spread for individual ratios in the text I read.
That is one federation in one year, and the equipment rules aren't stated in the text I read. These are self-selected competitors, so they may not represent typical gym-goers, and I found no reference data for people who don't compete.
The ratio shifts with body mass
A 2026 analysis of 101,898 drug-tested, classic (unequipped) lifters aged 21 to 49 covered IPF and national-affiliate meets from 2015 to 2026. The deadlift was the biggest share of the total in the lightweight classes, about 42 to 45%[2].
As body mass rose, the squat took a bigger share. The gap between the two lifts shrank from about 8 percentage points in the lightest male class to about 2 in the heaviest.
Per extra kilogram of body mass, the deadlift's share of the total fell by 0.044 percentage points in men and 0.032 in women, while the squat's rose by 0.027 in both[2].
Body mass explained little of the variation (R² 0.09 for men's deadlift share, 0.03 for women's), so it is a trend, not a prediction for you.
Older US data point the same way. In top-100 lists from 1995 to 2005, the squat and deadlift were very close in the lightest classes, and the squat passed the deadlift as weight class rose[3]. The lists didn't separate equipment, drug testing, age or sex, so I only use them for direction.
Reading Your Result
- Start with the plain ratio. It is just your two lifts divided, so it is only as good as the two numbers you entered.
- Compare it with the average for competition lifters of your sex. A gap tells you how you differ from that group, not that something is wrong.
- Think about body mass. Heavier lifters in the data have squats closer to their deadlifts, and I could not correct for that.
- If a lift is an estimate, read the range, not only the average.
- If you retest, compare the same lifts done the same way, because changes in depth or pulling style can change the loads you handle.
The calculator also shows the squat that would match the competition average from your deadlift, and the deadlift that would match it from your squat. Treat these as a reference point, not a goal.
Why Ratios Differ Between Lifters
- Sex. The competition averages differ, 116.1% for men against 121% for women[1]. The sources I read don't explain the gap, so I won't guess at a reason.
- Body mass. Squats catch up with deadlifts in heavier classes[2][3].
- Body proportions. In 59 male classic (unequipped) powerlifters, a larger deadlift share of the total went with smaller body weight and trunk length, and with longer lower legs and reach relative to height[4]. The correlations were modest (between 0.26 and 0.51 in size), from one championship, and they show association, not cause.
- Technique and style. Squat depth, bar position and sumo or conventional pulling plausibly change the loads you can lift. I found no study that measures this effect on the ratio, so the calculator doesn't adjust for it.
- How the lifts were measured. The competition figures are successful lifts from formally judged meets[1][3]. A gym max done to a different depth, or without judging, may not line up with them.
- Age and training history. The reference sample spans ages 15 to 78[1], but I found no ratio broken down by age or training years. That data is unavailable here.
What the Ratio Cannot Tell You
It does not show a muscle imbalance. I found no study that uses the squat to deadlift ratio to measure imbalance, so a high or low number isn't a diagnosis.
It does not predict injury. A narrative review of powerlifting injuries found limited evidence tying the squat, bench press or deadlift to specific injuries, mostly from case reports[5]. I found no study linking a squat to deadlift ratio to injury.
It does not cover bench press or bodyweight multiples. This page compares two lifts. Bench press ratios and bodyweight standards are separate questions and aren't answered here.
Getting a Number You Can Trust
- Best: two tested 1RMs, done the same way you will repeat them.
- Good enough: a hard set to failure on each lift with the same number of reps. The ratio is then your two weights divided, whichever equation you use.
- Roughest: sets with different reps. The equations disagree more as reps rise, and in one leg press and chest press study a 5RM predicted the 1RM better than a 10RM[7].
Even a good estimate carries error. In one study of untrained students, all seven equations read low for the deadlift, by 9 to 14%, and every equation except Wathan read low for the squat, by 2 to 8%[6]. The Australian Institute of Sport manual puts the variability of submaximal predictions at about 10%[8].
Numbers You May Have Seen Elsewhere
The previous version of this calculator, and plenty of other pages, carry guidance I couldn't trace to a source I could open. I left it out:
- A "sweet spot" of 0.75 to 0.85, with cut-offs at 0.70 and 0.90. The old page called these "proven powerlifting standards" and gave no source. For scale, the competition average for men in the data above, about 86.1%, sits just above that band.
- "Weak quads" for a low ratio and "weak posterior chain" for a high one. I found no evidence that this ratio measures either.
- Ratio ranges by body type, a fixed 8 to 12 week retest, and set training plans. The old page gave no source for any of them. The one study I found on body proportions reports modest correlations, not ranges[4].
The only limit I added myself is a typo check. It flags a squat below 40% or above 160% of the deadlift, and it is not a published range.
Things I couldn't verify: the equipment rules in the 2017 sample, how six of the seven equations were first derived, and whether the competition ratios apply to people who don't compete.
For rep-based 1RM estimates, see the One Rep Max Calculator, the 5 Rep Max Calculator and the 10 Rep Max Calculator.
Frequently Asked Questions
Sources & References
- Factors affecting powerlifting performance: an analysis of age- and weight-based determinants of relative strength. Latella C, Van den Hoek D, Teo WP. International Journal of Performance Analysis in Sport 18(4):532-544 (2018)
- Percentile-based normative standards for strength assessment beyond linear bodyweight multipliers in competitive powerlifters. Montenegro S, Wicker P, Wiedenmann T, Rappelt L, Donath L. Sports Medicine - Open 12:136 (2026)
- A retrospective analysis of powerlifting performances in the U.S. (1995-2005). Medler S. International Journal of Strength and Conditioning 6(1) (2026)
- Relationships between anthropometry and maximal strength in male classic powerlifters. Ferland PM, Laurier A, Comtois AS. International Journal of Exercise Science 13(4):1512-1531 (2020)
- Narrative review of injuries in powerlifting with special reference to their association to the squat, bench press and deadlift. Bengtsson V, Berglund L, Aasa U. BMJ Open Sport & Exercise Medicine 4(1):e000382 (2018)
- The accuracy of prediction equations for estimating 1-RM performance in the bench press, squat, and deadlift. LeSuer DA, McCormick JH, Mayhew JL, Wasserstein RL, Arnold MD. Journal of Strength and Conditioning Research 11(4):211-213 (1997)
- Prediction of one repetition maximum strength from multiple repetition maximum testing and anthropometry. Reynolds JM, Gordon TJ, Robergs RA. Journal of Strength and Conditioning Research 20(3):584-592 (2006)
- National Protocols for the Assessment of Strength and Power, Version 2.0 (effective July 2022). Australian Institute of Sport and the National Institute Network. Australian Sports Commission (2022)

Certified Personal Trainer & Sports Nutritionist
NASM-certified fitness and nutrition coach with over 10 years of hands-on experience helping people build strength, lose fat, and live healthier lives. Specializing in gym-based workouts with a strong focus on lifting technique, biomechanics, and practical exercise science. Through FitLifeRegime, sharing the tools, tips, and insights that have worked for hundreds of clients — helping you start your own fitness journey with confidence and clarity.
Learn more about Manish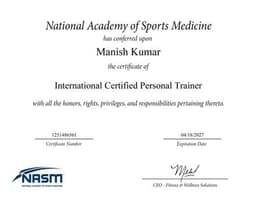
NASM Certified
Certified Personal Trainer & Sports Nutritionist from the National Academy of Sports Medicine
Disclaimer: This tool is for informational and personal journaling purposes only. Results are estimates based on published formulas and may vary based on individual factors such as genetics, training history, and measurement technique.