
The answer at a glance
Man, 55, 175 cm, 80 kg
599m
Predicted distance. The worked example is further down.
Same man, lower limit
446m
The 5th percentile of the healthy men in the study.
Healthy adults in the study
290
117 men and 173 women, aged 40 to 80.
Healthy people below the limit
1 in 20
That is what the 5th percentile means in the study group.
Key Takeaways
- Enter your sex, age, height and weight to see the distance a healthy person like you is predicted to walk in 6 minutes. Add the distance you walked and you also get a share of the prediction, the gap in metres and your average speed.
- The equations come from 117 healthy men and 173 healthy women aged 40 to 80[1]. The lower limit of normal sits 153 m under the prediction for men and 139 m under it for women.
- Published equations disagree with each other, and the 2014 ERS/ATS standard prefers one built on a local population[3]. Treat the result as a guide, and expect a warning outside ages 40 to 80 or above a BMI of 35[1].
- A short distance does not say why[2]. The 30 m change figure comes from people with chronic respiratory disease, not from healthy adults[4].
What the 6-Minute Walk Test Is
You walk back and forth along a flat course for six minutes, and the distance you cover is your score.
The test was built for clinics. The American Thoracic Society (ATS) called it a useful measure of functional capacity for people with at least moderately severe impairment[2]. A joint European and American standard from 2014 is meant to replace the ATS statement[3][6].
It will not tell you your fitness level. The ATS says the test does not measure peak oxygen uptake or diagnose why someone is breathless[2]. For a fitness estimate, try the Rockport Walking Test Calculator, the Cooper 12-Minute Test Calculator or the VO2 Max Calculator.
How to Do the 6-Minute Walk Test
Find a flat course of 30 m or more, skip the warm-up, and walk as far as you can in six minutes without running.
- Choose a flat, straight course with a hard surface and little foot traffic. The 2014 standard recommends 30 m or more[3]. The 2002 guidelines add an enclosed corridor with a mark every 3 m, a cone at each turn and a tape line at the start[2].
- Sit near the start first, for at least 10 minutes according to the 2002 guidelines[2]. Wear comfortable shoes, use your usual walking aid, skip the warm-up and avoid hard exercise in the 2 hours before[3].
- Start a 6-minute timer and walk as far as you can, but do not run or jog[3]. You may slow down, stop and rest, and the clock keeps running[3]. Start walking again as soon as you can[3].
- Ask a helper to count a lap each time you return to the start line. On a 30 m course a lap is 60 m, one length out and one back[2]. The standard allows only set phrases once a minute, such as "You are doing well. You have 5 minutes to go", and no other prompts[3].
- When the timer ends, mark where you stopped and measure the distance covered in the last lap[3]. Open "Work it out from laps" in the calculator and enter your laps, the course length and that extra distance.
Layout matters. A shorter corridor means more turns, though one multicenter study found no real effect for straight courses of 15 to 50 m[2]. People walked about 28 m farther on an oval track[2]. Use the same course every time.
Treadmills are not interchangeable
Who should not test alone
If you have a heart or lung condition, ask your doctor first. The 2014 standard lists unstable angina, a heart attack in the last 3 to 5 days, uncontrolled heart failure and fainting as absolute reasons not to test[3]. Severe untreated high blood pressure (200/120 mmHg) is a relative reason[3].
Stop for chest pain, intolerable breathlessness, leg cramps, staggering, heavy sweating or a pale, ashen look[3]. Clinics test where an emergency response is quick, so have someone with you at home[3].
6-Minute Walk Test Formula and Worked Example
Enright and Sherrill's 1998 equations predict the distance from height, age and weight, with a different equation for each sex.
Men
6MWD = (7.57 × height) − (5.02 × age) − (1.76 × weight) − 309
Height in cm, weight in kg, result in metres. The lower limit of normal is the prediction minus 153 m.
Women
6MWD = (2.11 × height) − (2.29 × weight) − (5.78 × age) + 667
Same units. The lower limit of normal is the prediction minus 139 m.
6MWD stands for 6-minute walk distance. The paper defines the lower limit as the 5th percentile of its healthy group, so about 1 in 20 healthy people walked less[1]. That is not a 95% confidence interval, which is how some calculators label it.
In the study, people who were older or heavier walked less, and so did shorter men[1]. Each extra year takes 5.02 m off the men's prediction and 5.78 m off the women's. Each extra kilogram takes off 1.76 m and 2.29 m.
(7.57 × 175) − (5.02 × 55) − (1.76 × 80) − 309
Lower limit of normal = 599 − 153 = 446
| Age | Men predicted (m) | Men limit (m) | Women predicted (m) | Women limit (m) |
|---|---|---|---|---|
| 40 | 674 | 521 | 622 | 483 |
| 45 | 649 | 496 | 593 | 454 |
| 50 | 624 | 471 | 564 | 425 |
| 55 | 599 | 446 | 535 | 396 |
| 60 | 574 | 421 | 506 | 367 |
| 65 | 549 | 396 | 477 | 338 |
| 70 | 524 | 371 | 449 | 310 |
| 75 | 498 | 345 | 420 | 281 |
| 80 | 473 | 320 | 391 | 252 |
What Is a Good 6-Minute Walk Distance?
There is no single good number. Age, sex, height and weight all move it, and studies disagree by tens of metres.
In the Enright and Sherrill group the median was 576 m for men and 494 m for women[1]. A seven-country group aged 40 to 80 averaged 571 m (SD 90), with men at 585 m and women at 555 m[5].
SD is the standard deviation, a measure of how spread out the walks were.
The ATS says the people sampled, the encouragement, the corridor length and the number of practice tests may all explain why studies differ[2]. No primary source gave a rating such as good or poor, so this page shows none.
| Age | Mean (m) | SD (m) |
|---|---|---|
| 40 to 49 | 611 | 85 |
| 50 to 59 | 588 | 91 |
| 60 to 69 | 559 | 80 |
| 70 to 80 | 514 | 71 |
The authors found geographic variation and advised against routine use of their own regression equation[5]. Only the age-band means are shown for that reason.
Repeating the Test and Reading a Change
A second walk usually runs a little longer than the first, so compare like with like.
The ATS reports a mean rise of 0 to 17% on a second test across studies[2]. In healthy adults in the seven-country study the second walk was 12 m longer on average[5].
To measure change over time, the 2014 standard asks for two tests at least 30 minutes apart, at about the same time of day on later visits[3]. The ATS suggests reporting change as an absolute value, for example "walked 50 m farther"[2].
For adults with chronic respiratory disease, the smallest change that matters is about 30 m, with a range of 25 to 33 m[4]. No figure for healthy people was found, so the calculator labels that comparison as patient data.
Who the Equations Do Not Suit
They describe one group of healthy adults, and the paper says so.
- Under 40 or over 80. The authors cautioned against using the equations outside the age range they studied[1]. The calculator still gives a number, with a warning.
- BMI over 35. Those people were left out of the healthy group[1]. So were people with a stroke, diuretic use, FEV1 under 70% of predicted, a low ankle-arm index or current smoking[1].
- Different populations. The paper urged caution for non-Caucasian people, and the group came from Tucson, Arizona[1]. The seven-country study found geographic variation and said to be careful with existing equations[5].
- A repeat walk. The equations apply to a first walk[1]. A second walk tends to run longer, so a repeat can read higher against them[2].
- A different course or a treadmill. Both change the distance[2], so the comparison no longer holds.
Different equations give different answers
The 2014 standard found 16 published equation studies and says applying them to one person gives substantial variation in the predicted distance[3]. It prefers an equation generated and verified in a local population, and says % predicted has not been shown to help track change over time[3].
So read the number as a guide, not a verdict.
Other Tests on This Site
If a walk test does not suit you, one of these may.
What Is Sourced and What Is Not
Each claim the calculator relies on, and how it is backed:
| Claim | Level | Source |
|---|---|---|
| The men's and women's prediction equations | Published paper, read | Enright and Sherrill 1998, Table 3, read in the full paper |
| Lower limit of normal as the 5th percentile: predicted minus 153 m (men) or 139 m (women) | Published paper, read | Enright and Sherrill 1998 |
| Built on 117 men and 173 women aged 40 to 80, a first walk, BMI over 35 excluded, caution outside ages 40 to 80 | Published paper, read | Enright and Sherrill 1998 |
| The 5th to 95th percentile of height and BMI in the study group, used for the edge-of-sample note | Published paper, read | Enright and Sherrill 1998, Table 2 |
| Percent of predicted and difference from predicted | Arithmetic | Your distance divided by, or minus, the predicted distance |
| Flat straight course of 30 m or more, no warm-up, standard encouragement every minute, laps plus the last partial lap recorded | Society statement, read | ERS/ATS technical standard 2014, read in the full text |
| Cones at the turns, marks every 3 m, a 60 m lap, 10 minutes of seated rest first | Society statement, read | ATS statement 2002, which the 2014 standard is meant to replace |
| Equations vary widely between studies, a local-population equation is preferred, and percent of predicted has not been shown useful for tracking change | Society statement, read | ERS/ATS technical standard 2014 |
| A low 6MWD is nonspecific and does not diagnose a cause | Society statement, read | ATS statement 2002 |
| Mean distance by age, 40 to 49 up to 70 to 80 | Published paper, read | Casanova et al. 2011, read in the full text; best of two tests, not a first walk |
| About 30 m (25 to 33 m) as the smallest change that matters | Society statement, read | ERS/ATS systematic review 2014, adults with chronic respiratory disease only |
| Average speed over the six minutes | Arithmetic | Distance divided by 360 seconds |
| Laps to distance | Arithmetic | Laps times two times the course length, plus the last partial lap |
| The body sizes in the example table (175 cm and 80 kg, 162 cm and 68 kg) | Own choice | Chosen for illustration, not from a paper |
| Impairment bands and a good, average or poor rating | Not used | Not used: no primary source was found |
What This Calculator Does Not Cover
These were left out because they could not be tied to a source.
Impairment bands
No primary source gives cut-offs such as 50% or 70% of predicted for mild, moderate or severe impairment, so no such labels are shown.
Other equations
Other published equations exist, and they give different predictions. Only Enright and Sherrill's are offered, because their printed coefficients were read in the paper.
The BMI-based equations
Enright and Sherrill also give versions that use BMI in place of height and weight. They are not offered.
Age bands by sex
The seven-country paper built age-specific standards for men and women. Only the age-band means for both sexes, printed in its text, are shown.
Training advice
No primary source gives a time frame for improving a 6-minute walk distance, so none is claimed.
Oxygen saturation, heart rate and breathlessness scores
The full clinical protocol records these with equipment and a trained tester. This page covers the distance only.
Frequently Asked Questions
Sources & References
- Reference equations for the six-minute walk in healthy adults. Enright PL, Sherrill DL. American Journal of Respiratory and Critical Care Medicine 158(5):1384-1387 (1998)
- ATS statement: guidelines for the six-minute walk test. ATS Committee on Proficiency Standards for Clinical Pulmonary Function Laboratories. American Journal of Respiratory and Critical Care Medicine 166(1):111-117 (2002)
- An official European Respiratory Society/American Thoracic Society technical standard: field walking tests in chronic respiratory disease. Holland AE, Spruit MA, Troosters T, et al.. European Respiratory Journal 44(6):1428-1446 (2014)
- An official systematic review of the European Respiratory Society/American Thoracic Society: measurement properties of field walking tests in chronic respiratory disease. Singh SJ, Puhan MA, Andrianopoulos V, et al.. European Respiratory Journal 44(6):1447-1478 (2014)
- The 6-min walk distance in healthy subjects: reference standards from seven countries. Casanova C, Celli BR, Barria P, et al.. European Respiratory Journal 37(1):150-156 (2011)
- Erratum: ATS statement: guidelines for the six-minute walk test. American Journal of Respiratory and Critical Care Medicine 193(10):1185 (2016)

Certified Personal Trainer & Sports Nutritionist
NASM-certified fitness and nutrition coach with over 10 years of hands-on experience helping people build strength, lose fat, and live healthier lives. Specializing in gym-based workouts with a strong focus on lifting technique, biomechanics, and practical exercise science. Through FitLifeRegime, sharing the tools, tips, and insights that have worked for hundreds of clients — helping you start your own fitness journey with confidence and clarity.
Learn more about Manish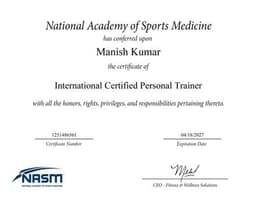
NASM Certified
Certified Personal Trainer & Sports Nutritionist from the National Academy of Sports Medicine
Disclaimer: This tool is for informational and personal journaling purposes only. Results are estimates based on published formulas and may vary based on individual factors such as genetics, training history, and measurement technique.