
The answer at a glance
Resting 60, max 190 bpm
48.5mL/kg/min
Heart rate ratio: 15.3 × max ÷ resting.
2,400 m in 12 minutes
42.4mL/kg/min
Cooper's 1968 equation.
1 MET equals
3.5mL/kg/min
Divide your VO2 max by 3.5 to get METs.
Typical error
± 2.7or more
Heart rate ratio, measured max. It is 4.7 with an age-predicted max.
Key Takeaways
- VO2 max is the most oxygen your body can use per minute in hard exercise. This calculator estimates it from a resting and maximum heart rate, a 12-minute run or a 1-mile walk, or converts a value you already have.
- Each estimate comes with the error its source reports where there is one. The heart rate ratio method has a standard error of 2.7 mL/kg/min with a measured maximum and 4.7 with an age-predicted one[1].
- The heart rate ratio method was tested in 46 well-trained men aged 21 to 51[1]. The Rockport equation covers adults aged 30 to 69[3]. The calculator warns when you are outside those groups.
- The 12-minute run equation came from 115 US Air Force men, average age 22, and the paper had no women[4]. It prints a correlation but no standard error, so no error range is shown for this method.
- Your result is compared with HUNT3, a Norwegian lab-measured group[6]. The gap is shown in standard deviations, not as a grade.
What Aerobic Capacity and VO2 Max Mean
Aerobic capacity and VO2 max usually mean the same number: the most oxygen you can use in a minute.
It is written two ways. Relative VO2 max is in millilitres of oxygen per kilogram of body weight per minute (mL/kg/min). Absolute VO2 max is in litres per minute (L/min) and does not divide by weight.
A third way is METs, where one MET is 3.5 mL/kg/min by the usual convention. A VO2 max of 42 mL/kg/min is 12.0 METs.
A lab test measures VO2 max from the air you breathe out. The methods on this page estimate it instead, so each one carries an error that the calculator shows where the source gives one.
VO2 Max Formulas Used Here
Three field equations and one unit converter, each tied to the study it came from.
Every equation below matches the abstract or full text of its paper. The table says who each one was built on, because that decides who it suits.
Heart rate ratio (Uth 2004)
VO2 max = 15.3 × HRmax ÷ HRrest
Heart rates in beats per minute. The factor of 15.3 came from a subgroup of 10 of the 46 men in the study.
Estimated maximum heart rate (Tanaka 2001)
HRmax = 208 − 0.7 × age
Used only when you leave maximum heart rate blank. It comes from a meta-analysis of 18,712 people.
12-minute run (Cooper 1968)
VO2 max = (miles − 0.3138) ÷ 0.0278
Miles covered in 12 minutes. Cooper printed miles = 0.3138 + 0.0278 × VO2 max. This is that line turned around.
1-mile walk (Kline 1987)
L/min = 6.9652 + 0.0091 × lb − 0.0257 × age + 0.5955 × sex − 0.224 × minutes − 0.0115 × HR
Sex is 1 for men and 0 for women. HR is your heart rate in the fourth quarter mile. Divide by your weight in kg and multiply by 1,000 for mL/kg/min.
The Kline equation is the one printed in the paper's abstract[3]. It gives litres per minute, so the calculator converts it with your weight. Many calculators print a mL/kg/min version instead, which the abstract does not show, so it is not used here.
| Method | People studied | Error reported |
|---|---|---|
| Heart rate ratio | 46 trained men, ages 21 to 51 | 2.7 or 4.7 mL/kg/min |
| 1-mile walk | 343 adults, ages 30 to 69 | 0.355 L/min |
| 12-minute run | 115 US Air Force men, average age 22 | None printed |
The Heart Rate Ratio Method and Resting Heart Rate
The higher your maximum heart rate is compared with your resting one, the higher this method puts your VO2 max.
Uth and colleagues proposed that VO2 max is about 15.3 times the ratio of maximum to resting heart rate[1]. It needs no exercise test if you already know both numbers.
15.3 × 190 ÷ 60
A maximum you measured in a hard effort is better than an estimate. With one, the paper reports a standard error of 2.7 mL/kg/min. With an age-predicted maximum it is 4.7[1].
If errors are roughly normal, about two thirds of estimates fall within one standard error of the true value. That is an assumption, not a figure from the paper.
If you leave the maximum blank, the calculator uses 208 − 0.7 × age[2]. At 40 that is 180.0 bpm, so a resting rate of 60 gives 45.9 mL/kg/min. The paper does not say which age equation its own figure of 4.7 used, so that error is shown as theirs, not Tanaka's.
Where this method may not hold
The authors tested it in well-trained men and said other groups need direct validation[1]. The calculator marks the result as a rough guide for women and for ages outside 21 to 51.
The abstract does not cover people who take medicine that changes heart rate, such as beta-blockers. Both inputs would change, so ask your doctor before relying on the result.
12-Minute Run and 1-Mile Walk: How to Take the Tests
Both tests need flat ground and an honest effort. Either one lowers the estimate if you ease off.
For the 12-minute run, cover the longest distance you can in exactly 12 minutes, running where you can and walking when you have to, and measure it. Cooper's men ran on a flat, accurately measured course, at least twice[4]. At 2,400 m (1.49 miles) the equation gives 42.4 mL/kg/min. The Cooper 12-Minute Test Calculator adds laps, pace and Cooper's fitness levels.
Cooper saw more scatter below about 2,253 m (1.4 miles) and linked it to motivation[4]. Most of his men were under 25, so he said accuracy in older people was hard to predict. He added that early signs for people up to at least 50 compared favourably.
For the 1-mile walk, cover one mile (1,609 m) as fast as you can. Kline's walkers did at least two walks and the study used the fastest two[3]. Their heart rate was monitored continuously and recorded at each quarter mile, and the equation uses the fourth-quarter reading.
A pulse counted after you stop will usually be lower than the reading at the finish, and that pushes the estimate up. If you can, wear a heart rate monitor.
6.9652 + 0.0091 × 180 − 0.0257 × 35 + 0.5955 × 1 − 0.224 × 15 − 0.0115 × 130 = 3.444 L/min
3.444 × 1,000 ÷ 81.6 kg
In cross-validation the walk equation had a standard error of 0.355 L/min[3]. For an 81 kg person that is about 4.4 mL/kg/min.
Before a hard test
Both tests ask for a hard effort. If you have a heart or lung condition, take medicine that affects your heart rate, or have not exercised in a long time, get medical advice first.
Relative VO2 Max, Absolute VO2 Max and METs
Relative VO2 max divides your oxygen use by your weight. Absolute VO2 max does not.
To go from litres per minute to mL/kg/min, multiply by 1,000 and divide by your weight in kilograms. To go the other way, multiply by your weight and divide by 1,000. The Lab value tab does both.
3.4 L/min × 1,000 ÷ 80 kg = 42.5 mL/kg/min
42.5 ÷ 3.5 = 12.1 METs
The weight what-if holds your litres per minute fixed and divides by a different weight. At 75 kg, 3.4 L/min becomes 45.3 mL/kg/min, a change of 2.8.
A what-if, not a forecast
Real weight loss can also change how much oxygen you use. The what-if only shows the arithmetic of dividing by a smaller number. It does not predict what a retest would show.
Average VO2 Max by Age and Sex (HUNT3)
These are measured averages from Norway. Your result is shown against them in standard deviations.
HUNT3 measured VO2 max during treadmill running in 1,929 men and 1,881 women aged 20 to 90, all healthy and Norwegian[6]. The table shows the mean and, in brackets, the standard deviation for each decade.
| Age | Men | Women | People (men / women) |
|---|---|---|---|
| 20 to 29 | 54.4 (8.4) | 43 (7.7) | 199 / 215 |
| 30 to 39 | 49.1 (7.5) | 40 (6.8) | 324 / 359 |
| 40 to 49 | 47.2 (7.7) | 38.4 (6.9) | 526 / 493 |
| 50 to 59 | 42.6 (7.4) | 34.4 (5.7) | 466 / 428 |
| 60 to 69 | 39.2 (6.7) | 31.1 (5.1) | 300 / 240 |
| 70 and over | 35.3 (6.5) | 28.3 (5.2) | 76 / 53 |
A standard deviation is a typical spread around the average. About two thirds of a group fall within one SD of its mean, if values are roughly normal. The calculator does not call a result good or poor, because the table has no such cut-offs.
For health context, Kodama and colleagues pooled 33 observational studies of healthy people[5]. Their groups were under 7.9 METs, 7.9 to 10.8 and 10.9 or more. Each 1 MET higher went with a relative risk of 0.87 for all-cause death and 0.85 for coronary heart disease or cardiovascular events.
Those are links in group data, not proof of cause, and they do not predict one person's health.
Other VO2 Max Tests on This Site
If you use a bike, a rower, a step or a 1.5-mile run, one of these fits better.
What This Calculator Does Not Cover
These were left out because they could not be tied to a source.
Fitness age and a grade
There is no sourced rule for turning a VO2 max into a fitness age or a label like Superior or Poor, so none is shown. The HUNT3 gap is the only comparison.
A female adjustment
Some calculators multiply the heart rate result by 0.88 for women. No source for that factor was found, and the heart rate study had no women, so the page warns instead.
Ways to raise VO2 max
A training section needs a primary source for every claim and none is cited here. The page leaves it out instead of repeating percentages that cannot be checked.
Watch and app estimates
This page does not check or explain how a watch or app arrives at its number. You can type that value into the Lab value tab to convert units.
Lab accuracy claims
No error is stated for a lab measurement, because no source for one was used. Use the value as given.
Values outside the studies
Results are never clamped or hidden. If an estimate falls outside the range the studies measured, the calculator shows it with a warning.
Frequently Asked Questions
Sources & References
- Estimation of VO2max from the ratio between HRmax and HRrest--the Heart Rate Ratio Method. Uth N, Sørensen H, Overgaard K, Pedersen PK. European Journal of Applied Physiology 91(1):111-115 (2004)
- Age-predicted maximal heart rate revisited. Tanaka H, Monahan KD, Seals DR. Journal of the American College of Cardiology 37(1):153-156 (2001)
- Estimation of VO2max from a one-mile track walk, gender, age, and body weight. Kline GM, Porcari JP, Hintermeister R, et al.. Medicine and Science in Sports and Exercise 19(3):253-259 (1987)
- A means of assessing maximal oxygen intake. Correlation between field and treadmill testing. Cooper KH. JAMA 203(3):201-204 (1968)
- Cardiorespiratory fitness as a quantitative predictor of all-cause mortality and cardiovascular events in healthy men and women: a meta-analysis. Kodama S, Saito K, Tanaka S, et al.. JAMA 301(19):2024-2035 (2009)
- Aerobic capacity reference data in 3816 healthy men and women 20-90 years. Loe H, Rognmo Ø, Saltin B, Wisløff U. PLoS ONE 8(5):e64319. A correction to Table 2 was published in November 2013 (2013)

Certified Personal Trainer & Sports Nutritionist
NASM-certified fitness and nutrition coach with over 10 years of hands-on experience helping people build strength, lose fat, and live healthier lives. Specializing in gym-based workouts with a strong focus on lifting technique, biomechanics, and practical exercise science. Through FitLifeRegime, sharing the tools, tips, and insights that have worked for hundreds of clients — helping you start your own fitness journey with confidence and clarity.
Learn more about Manish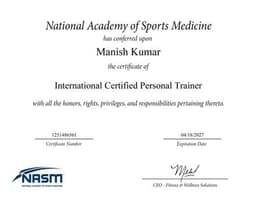
NASM Certified
Certified Personal Trainer & Sports Nutritionist from the National Academy of Sports Medicine
Disclaimer: This tool is for informational and personal journaling purposes only. Results are estimates based on published formulas and may vary based on individual factors such as genetics, training history, and measurement technique.