
Key Takeaways
- Your 8RM is the heaviest weight you can lift for 8 reps. This calculator estimates it from a hard set of 2 to 10 reps, or from a 1RM you already know, using seven published equations[2].
- A set of 8 reps to failure is already your 8RM. The calculator returns the weight you lifted and builds the 1RM and the other rep loads on top of it.
- The 8RM is not a fixed share of the 1RM. The seven equations put 8 reps at 78.3% to 83.3% of the 1RM, and a published RPE chart gives 79%, an estimate rather than a measured value[2][5]. Any single "80%" rule is a rough guide.
- The equations were built to predict a 1RM from reps to fatigue[1][2]. No study tests them for predicting an 8RM, and the Australian Institute of Sport testing manual allows for an error of about 10%[10].
- Eight reps is a handy way to pick a working weight, not a magic number. The 2026 ACSM position stand found no difference in muscle growth between loads of 30% and 100% of 1RM[7].
What an 8RM Is, and What It Is Not
An 8 rep max (8RM) is the heaviest weight you can lift for exactly 8 reps with the form you would accept in a working set. If you can do a ninth rep, the weight was below your 8RM.
It is the same idea as a 1RM, 3RM or 10RM, just a different rep count. The number you get here is a prediction, not a test: roughly what a hard set of eight should be, based on a set you already did or a 1RM you already know.
A set of 8 is your 8RM only if it went to failure
If you stopped with reps left, the weight was under your 8RM. Choose "Stopped short" in the calculator and pick the effort. It then reads a published RPE chart instead of the seven equations[5].
How the Estimate Works
Every equation here was written to turn a set taken to fatigue into a 1RM. The calculator runs each one forward to get a 1RM, then runs the same equation backwards to get the load for 8 reps.
What happens when you press Calculate
- Each equation turns your weight and reps into a 1RM estimate.
- The same equation then divides that 1RM by its own 8-rep factor to get an 8RM.
- The page shows the lowest, highest and average of the seven answers.
- For comparison, it also applies the Helms chart, which puts 8 reps at RPE 10 at 79% of 1RM[5].
The seven equations are printed in LeSuer and colleagues' Table 1[2]. Here they are with the share of 1RM each one gives for 8 reps:
| Equation | Form | 8 reps as % of 1RM | Original publication |
|---|---|---|---|
| Epley | 1RM = w × (1 + 0.0333 × r) | 79% | Epley, Poundage Chart, 1985 (not opened) |
| Brzycki | 1RM = 100 × w ÷ (102.78 − 2.78 × r) | 80.5% | Brzycki, 1993 (opened and checked) |
| Lander | 1RM = 100 × w ÷ (101.3 − 2.67123 × r) | 79.9% | Lander, NSCA Journal, 1985 (not opened) |
| Lombardi | 1RM = w × r^0.1 | 81.2% | Lombardi, Beginning Weight Training, 1989 (not opened) |
| Mayhew | 1RM = 100 × w ÷ (52.2 + 41.9 × e^(−0.055 × r)) | 79.2% | Mayhew et al., J Appl Sport Sci Res, 1992 (not opened) |
| O'Conner | 1RM = w × (1 + 0.025 × r) | 83.3% | O'Conner et al., Weight Training Today, 1989 (not opened) |
| Wathan | 1RM = 100 × w ÷ (48.8 + 53.8 × e^(−0.075 × r)) | 78.3% | Wathan, in Baechle (ed.), 1994 (not opened) |
w is the weight lifted and r is the reps to fatigue. The last column is arithmetic on each equation at 8 reps.
Brzycki's own paper has a table of results for this equation. For example, 100 lb for 8 reps predicts a 1RM of 124 lb, and 200 lb for 3 reps predicts 212 lb[1]. The calculator reproduces those values in its tests.
The other six come from LeSuer's printed table rather than their original publications, so treat those coefficients as second-hand.
Worked example: 100 kg for 5 reps to failure
Brzycki 1RM = 100 × 100 ÷ (102.78 − 2.78 × 5) = 112.5 kg
Brzycki 8RM = 112.5 ÷ (100 ÷ (102.78 − 2.78 × 8)) = 90.6 kg
Epley 1RM = 100 × (1 + 0.0333 × 5) = 116.7 kg
Epley 8RM = 116.7 ÷ (1 + 0.0333 × 8) = 92.1 kg
The average is there because most people want one number. No study names a best equation or tests the average itself, so lean on the range.
8RM to 1RM, and 1RM to 8RM
To get a 1RM from a real 8RM, choose "I lifted a set" and keep the reps at 8. For 100 kg for 8 reps to failure, the seven equations give a 1RM of 120 to 127.7 kg, with an average of 124.7 kg.
The Helms chart gives one value instead: 100 kg for 8 reps at RPE 10 is 79% of 1RM, so a 1RM of 126.6 kg[5]. That sits inside the equation range.
To go the other way, choose "I know my 1RM". A 1RM of 100 kg gives an 8RM of 78.3 to 83.3 kg across the equations, and 79 kg on the Helms chart. Running an equation backwards like this is arithmetic that no study has tested.
8RM as a Percentage of 1RM
You will often see an 8RM given as about 80% of the 1RM. The seven equations give 78.3% to 83.3% at 8 reps, so the rule of thumb sits inside that spread but matches none of them exactly[2].
The chart below compares the mean of the seven equations with the Helms chart at RPE 10. The Helms chart stops at 8 reps[5].
| Reps | Seven equations, % of 1RM | Helms chart, RPE 10 |
|---|---|---|
| 1 | 100% | 100% |
| 2 | 94.3% | 95% |
| 3 | 91.5% | 91% |
| 4 | 89% | 87% |
| 5 | 86.6% | 85% |
| 6 | 84.4% | 83% |
| 7 | 82.3% | 81% |
| 8 | 80.2% | 79% |
| 9 | 78.3% | No value |
| 10 | 76.4% | No value |
Share of 1RM at each rep count for a set to failure. The equation column is the mean of the seven equations for a 100 kg 1RM.
The Helms chart also lists a share of 1RM for 8 reps at each effort, from RPE 10 (no reps left) down to RPE 7 (about 3 reps left)[5]:
| RPE | 10 | 9.5 | 9 | 8.5 | 8 | 7.5 | 7 |
|---|---|---|---|---|---|---|---|
| 8 reps, % of 1RM | 79% | 77.5% | 76% | 74.5% | 73% | 71.5% | 70% |
Estimated % of 1RM for 8 reps by RPE (Helms et al., 2016, Table 2).
That is why the calculator offers an RPE choice and a load-by-effort table. To work out your RPE from reps in reserve, use the RIR to RPE Calculator. To go from RPE and reps to a 1RM, use the RPE to 1RM Calculator.
How Accurate Is It?
Here is what each study looked at, so you can judge how far to trust a number:
| Source | What it found | Limit |
|---|---|---|
| LeSuer et al., 1997[2] | 67 untrained college students (some skipped the squat and deadlift). All seven equations correlated highly with the measured 1RM (r above 0.95). Bench press: only Mayhew and Wathan did not differ significantly from the measured 1RM, and the rest underestimated it by 0.8 to 6% on average. Squat: only Wathan did not differ, and the rest underestimated by 2 to 8%. Deadlift: all seven underestimated, by 9 to 14%. | Untrained students. Predicted a 1RM, not an 8RM. |
| Reynolds et al., 2006[3] | 70 people aged 18 to 69 did 1, 5, 10 and 20RM tests on the barbell bench press and a plate-loaded leg press. The 5RM gave the best 1RM prediction, and the authors advise using no more than 10 reps in linear equations. | Bench press and leg press only. No 8RM test. |
| Mayhew et al., 2008[4] | 103 young women did bench press tests before and after 12 weeks of training. Prediction equations were more accurate when fewer than 10 reps to fatigue were used. | Young women, bench press only. |
| Zourdos et al., 2016[6] | 29 lifters (15 experienced, 14 novice) did a back squat 1RM, then single reps at 60, 75 and 90% and one set of 8 reps at 70%. Each rated effort as reps in reserve. The Helms chart uses these ratings. | Back squat only. One 8-rep set, at 70% of 1RM. |
- Fewer reps is safer. Brzycki says his equation is only valid below 10 reps to fatigue[1]. Reynolds advises no more than 10 reps in linear equations[3], and Mayhew found better accuracy when fewer than 10 reps were used[4]. That is why the calculator accepts 2 to 10 reps and warns at 8 or more.
- The set must go to failure. These equations were built from reps to fatigue. A pooled analysis of 12 studies found lifters tend to under-predict how many reps they have left, by about 1 rep on average, with large differences between studies[9]. That was about predicting reps, not about stopping a set. Still, if you end a set at what feels like failure, it may have had a rep or so left, and the equations would then read low. This part is an inference, not something those studies tested.
- The Helms chart is mostly estimated. Its authors say only the single reps at 100% and 90%, and the 8 reps at 70% of 1RM, rest on measured ratings. The other cells, including 79% for 8 reps at RPE 10, are estimations. The chart is also based on trained lifters doing the barbell back squat[5].
- Effort ratings vary between lifters. At 8 reps and 70% of 1RM (70% on the chart at RPE 7), the standard deviation was 1.2 RPE points. About two-thirds of lifters would report between 2 and 4 reps left, and some as few as 1 or as many as 5[5].
- An 8RM is a stretch of the method. The studies test the 1RM that comes out. None checks an 8RM from the same equation, so an 8RM from this page can be off by an unknown amount. The testing manual of the Australian Institute of Sport says estimates from submaximal reps carry about plus or minus 10%[10].
- Who and what was studied. Mostly students and adults aged 18 to 69[2][3]. Accuracy data cover the bench press, squat, deadlift and leg press. No data exists for teenagers, people over 70 or other lifts, so the calculator warns outside 18 to 69.
Testing a Real 8RM
No source gives a test protocol written for an 8RM. The Australian Institute of Sport manual covers 1RM, 3RM and 6RM tests, including warm-up, rest and spotter rules[10]. Those rules are a sensible guide for a hard set of eight, but they were not written for one.
If you test it, use the calculator result as your opening load. Set up spotters or safety bars, and write down the weight and the reps you completed.
8RM and Muscle Growth
You will see 8 to 12 reps recommended for muscle growth in a lot of places. That comes from the 2009 ACSM position stand, which suggested 8 to 12 RM for novices and a 6 to 12 RM emphasis for hypertrophy[12]. The 2026 update replaces it and does not repeat those rep ranges.
The 2026 stand is an overview of 137 systematic reviews. Muscle growth did not differ between loads of 30% and 100% of 1RM, or between sets taken to failure and sets that were not[7]. More weekly volume did help, at 10 or more sets per muscle group, and so did eccentric overload.
Strength is different. The same stand found larger strength gains with heavier loads, at 80% of 1RM or more[7]. The equations put an 8RM at about 78.3% to 83.3% of 1RM, so it sits right around that line.
A 2021 review reached a similar view on loading: muscle adaptations can be obtained, and in some cases optimised, across a wide spectrum of loads[8]. So use an 8RM load if you like training around 8 reps. This page makes no claim that 8 beats lower or higher rep counts.
Using the Result
- Start from a set of 3 to 5 hard reps if you can. Fewer reps keep you well inside the range the equations were built for[1][3].
- Read the range, not just the average. If the range is wide, you have less reason to trust any single number.
- Treat the 8RM as a starting load for a real set. If you plan to stop short of failure, use the load-by-effort table instead: it gives the Helms chart load for 8 reps at each RPE.
- The 2009 ACSM stand suggested raising a load by 2 to 10% once you can do 1 to 2 reps more than the target[12]. For an 8RM, that means adding weight when 9 or 10 reps feel doable. The 2026 update does not restate this rule, so treat it as older guidance.
- For other rep targets, see the 5 Rep Max Calculator, 10 Rep Max Calculator or the One Rep Max Calculator.
What This Page Does Not Cover
- Strength levels and standards for an 8RM. No source gives 8RM standards, so there is no level, rank or benchmark. Normative data do exist for squat, bench press and deadlift strength in drug-tested, unequipped powerlifting competitions. They cover 809,986 entries, split by sex, age group and weight class, with the 10th to 90th percentile for each[11]. They describe competition lifters and say nothing about 8 reps. For a score among lifters, use the DOTS Calculator.
- Sets, rest periods and tempo for an 8RM. No source ties these to an 8RM specifically, so the page does not prescribe them.
Frequently Asked Questions
Sources & References
- Strength testing: predicting a one-rep max from reps-to-fatigue. Brzycki M. Journal of Physical Education, Recreation & Dance 64(1):88-90 (1993)
- The accuracy of prediction equations for estimating 1-RM performance in the bench press, squat, and deadlift. LeSuer DA, McCormick JH, Mayhew JL, Wasserstein RL, Arnold MD. Journal of Strength and Conditioning Research 11(4):211-213 (1997)
- Prediction of one repetition maximum strength from multiple repetition maximum testing and anthropometry. Reynolds JM, Gordon TJ, Robergs RA. Journal of Strength and Conditioning Research 20(3):584-592 (2006)
- Accuracy of prediction equations for determining one repetition maximum bench press in women before and after resistance training. Mayhew JL, Johnson BD, LaMonte MJ, Lauber D, Kemmler W. Journal of Strength and Conditioning Research 22(5):1570-1577 (2008)
- Application of the repetitions in reserve-based rating of perceived exertion scale for resistance training. Helms ER, Cronin J, Storey A, Zourdos MC. Strength and Conditioning Journal 38(4):42-49 (2016)
- Novel resistance training-specific rating of perceived exertion scale measuring repetitions in reserve. Zourdos MC, Klemp A, Dolan C, Quiles JM, Schau KA, Jo E, Helms E, Esgro B, Duncan S, Garcia Merino S, Blanco R. Journal of Strength and Conditioning Research 30(1):267-275 (2016)
- American College of Sports Medicine position stand. Resistance training prescription for muscle function, hypertrophy, and physical performance in healthy adults: an overview of reviews. Currier BS, D'Souza AC, Singh MAF, Lowisz CV, Rawson ES, Schoenfeld BJ, et al.. Medicine & Science in Sports & Exercise 58(4):851-872 (2026)
- Loading recommendations for muscle strength, hypertrophy, and local endurance: a re-examination of the repetition continuum. Schoenfeld BJ, Grgic J, Van Every DW, Plotkin DL. Sports 9(2):32 (2021)
- Accuracy in predicting repetitions to task failure in resistance exercise: a scoping review and exploratory meta-analysis. Halperin I, Malleron T, Har-Nir I, Androulakis-Korakakis P, Wolf M, Fisher J, Steele J. Sports Medicine 52(2):377-390 (2022)
- National Protocols for the Assessment of Strength and Power, Version 2.0 (effective July 2022). Australian Institute of Sport and the National Institute Network. Australian Sports Commission (2022)
- Normative data for the squat, bench press and deadlift exercises in powerlifting: data from 809,986 competition entries. van den Hoek D, Beaumont PL, van den Hoek AK, Owen PJ, Garrett JM, Buhmann R, et al.. Journal of Science and Medicine in Sport (2024)
- American College of Sports Medicine position stand. Progression models in resistance training for healthy adults (replaced by the 2026 position stand above). American College of Sports Medicine. Medicine & Science in Sports & Exercise 41(3):687-708 (2009)

Certified Personal Trainer & Sports Nutritionist
NASM-certified fitness and nutrition coach with over 10 years of hands-on experience helping people build strength, lose fat, and live healthier lives. Specializing in gym-based workouts with a strong focus on lifting technique, biomechanics, and practical exercise science. Through FitLifeRegime, sharing the tools, tips, and insights that have worked for hundreds of clients — helping you start your own fitness journey with confidence and clarity.
Learn more about Manish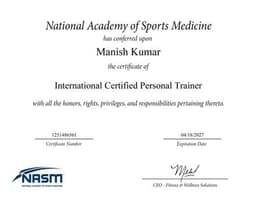
NASM Certified
Certified Personal Trainer & Sports Nutritionist from the National Academy of Sports Medicine
Disclaimer: This tool is for informational and personal journaling purposes only. Results are estimates based on published formulas and may vary based on individual factors such as genetics, training history, and measurement technique.