
Key Takeaways
- Your pull-up 1RM is the heaviest load you can pull for one strict rep. This calculator estimates it from a hard set of 1 to 10 reps, counts your bodyweight as part of the load, and then shows how much of that is added weight[2][8].
- The equations run on bodyweight plus belt weight, and the page subtracts bodyweight at the end. The pull-up studies define a 1RM the same way[5][8].
- You get an average and a range across seven published equations. None of them was tested on pull-ups, so treat the result as an estimate and not a measured max[2][3].
- In 15 adult male athletes, the pull-up 1RM averaged 1.43× bodyweight[5]. That is a small group of men, and no matching figure for women was found.
- No source gives a chin-up conversion, an assisted-pull-up load, strength standards by bodyweight or a share of bodyweight for the pull-up, so they aren't here. The last section lists them.
What a Pull-Up 1RM Is, and Which Number to Use
A pull-up 1RM is the heaviest load you can pull for one strict rep. That load is your body plus whatever hangs from your belt.
So the same max can be written two ways. The total 1RM includes your bodyweight, and the added-weight 1RM is the total minus bodyweight. Lifters often quote the second one, as in +30 kg.
The calculator shows both. Mixing them up gives numbers that look wrong, which is why the load tables below say which one they use.
Does Bodyweight Count in a Weighted Pull-Up?
Yes, in every source here that defines it. Sánchez-Moreno and colleagues calculated the 1RM as the maximum added weight plus the lifter's body mass, because subjects needed to lift their own body[8]. The AIS testing manual does the same: total weight lifted is body mass plus plates plus belt[10].
Coyne's thesis counts relative strength that way too[6]. The AIS manual also says to weigh the belt and add it in, and to take body mass with clothes and shoes on[10].
So this tool puts your full bodyweight in the load. A pull-up may not move exactly 100% of your body mass, and no measured figure exists for that share. Treat full bodyweight as a convention, not a measurement.
Some calculators scale bodyweight by a fixed fraction for pull-ups. No measurement backs one, so none is used. Assisted pull-ups with a band or machine are not supported for the same reason.
The Formula and a Worked Example
What happens when you press Calculate
- Your bodyweight plus the weight on your belt gives the load.
- Each of seven equations turns that load and your reps into a total 1RM[2].
- Subtracting your bodyweight gives the added-weight 1RM for each equation.
- The page shows the average, the lowest and the highest.
LeSuer and colleagues print the seven equations in their Table 1[2]. Here they are, with the multiplier each gives at 5 reps:
| Equation | Form | 1RM ÷ load at 5 reps | Original publication |
|---|---|---|---|
| Epley | 1RM = w × (1 + 0.0333 × r) | 1.167 | Epley, Poundage Chart, 1985 (not opened) |
| Brzycki | 1RM = 100 × w ÷ (102.78 − 2.78 × r) | 1.125 | Brzycki, 1993 (opened and checked) |
| Lander | 1RM = 100 × w ÷ (101.3 − 2.67123 × r) | 1.137 | Lander, NSCA Journal, 1985 (not opened) |
| Lombardi | 1RM = w × r^0.1 | 1.175 | Lombardi, Beginning Weight Training, 1989 (not opened) |
| Mayhew | 1RM = 100 × w ÷ (52.2 + 41.9 × e^(−0.055 × r)) | 1.19 | Mayhew et al., J Appl Sport Sci Res, 1992 (not opened) |
| O'Conner | 1RM = w × (1 + 0.025 × r) | 1.125 | O'Conner et al., Weight Training Today, 1989 (not opened) |
| Wathan | 1RM = 100 × w ÷ (48.8 + 53.8 × e^(−0.075 × r)) | 1.166 | Wathan, in Baechle (ed.), 1994 (not opened) |
w is the load lifted (bodyweight plus added weight) and r is the reps to fatigue. The last column is arithmetic on each equation at 5 reps.
Brzycki's paper has its own table for this equation. A 100 lb set of 3 predicts a 1RM of 106 lb, and 225 lb for 10 reps predicts about 300 lb[1]. The calculator reproduces those values in its tests.
The other six equations come from LeSuer's table rather than their original publications, so how they were derived is not known here.
Worked example: 80 kg bodyweight, +20 kg, 5 reps to failure
Load = 80 + 20 = 100 kg
Epley total 1RM = 100 × (1 + 0.0333 × 5) = 116.7 kg, which is +36.7 kg added
Brzycki total 1RM = 100 × 100 ÷ (102.78 − 2.78 × 5) = 112.5 kg, which is +32.5 kg added
A set of exactly 1 skips the equations. One rep to failure is already your max, and the equations would add a few percent to it.
How Accurate Is It?
No study that tested these seven equations on pull-ups turned up. This is what each source did look at, so you can judge how far to trust a number:
| Source | What it found | Limit |
|---|---|---|
| LeSuer et al., 1997[2] | 67 untrained college students (40 men, 27 women) did a 1RM and a set to fatigue on the bench press, squat and deadlift. All seven equations correlated highly with the measured 1RM (r above 0.95), but the average miss was still significant. On the bench press that was true for all but 2 equations, on the squat all but 1, and all seven underestimated the deadlift. | Not pull-ups. Untrained students, and the error changed with the lift. |
| Reynolds et al., 2006[3] | 70 people aged 18 to 69 did 1, 5, 10 and 20RM tests on the barbell bench press and a plate-loaded leg press. The authors advise no more than 10 reps in linear equations. | Bench press and leg press, not pull-ups. |
| Mayhew et al., 2008[4] | 103 young women did bench press tests before and after 12 weeks of training. Prediction equations were more accurate when fewer than 10 reps to fatigue were used. | Young women, bench press only. |
| Baker, rugby league study[9] | The only pull-up rep-prediction study found. 23 male professional rugby league players did a pull-up 1RM and then as many reps as possible at body mass. The reps they achieved correlated with the reps predicted from a table of correction factors (r = 0.83). | Only the abstract is open. It tested a correction-factor table, not these seven equations, and it gives no error size in kg. Male pro athletes only. |
| Coyne et al., 2015[5] | 15 adult men did a true pull-up 1RM twice, a week apart. The tests were highly reliable (ICC 0.96 to 0.99 across the pull-up and dip tests). | It measured a real 1RM and did not test any prediction equation. Men only, from recreational to international level. |
| Muñoz-López et al., 2017[7] | 82 resistance-trained men showed a near-linear link between bar speed and load in the pull-up (individual R² of 0.975 on average). The authors say that allows a 1RM to be estimated from movement velocity. | A different method that needs a velocity device, and the abstract does not give the error of the estimate. It does not test rep-based equations. |
| Australian Institute of Sport, 2025 (Version 3.0)[10] | Its testing manual says predictive equations should not be used to calculate a 1RM. It says they are influenced by the muscle group, the exercise and the training level, with large variability (±10%) when submaximal reps predict a max. It says to record the weight lifted and the reps completed. | A testing manual that cites earlier studies, not a new experiment. Written for formal athlete testing. |
- Nobody tested these seven equations on pull-ups. The sources used the bench press, squat, deadlift and leg press. The errors also changed from lift to lift (see the table), so they may not carry over to a lift that moves your own body.
- Use a heavy set with few reps, but not more than 10. Brzycki says his equation is only valid below 10 reps to fatigue[1], and Mayhew found better accuracy below 10[4]. Reynolds advises no more than 10[3]. So the calculator accepts 1 to 10 reps and warns from 8.
- The set must go to failure. The equations assume reps to fatigue. If you stopped with reps left, the estimate reads low.
- Bodyweight-only sets are the roughest input. With nothing added, the estimate rests entirely on your rep count. A set with some weight added and fewer reps is a better input, because the sources found fewer reps more accurate.
- A real max test beats an estimate. The AIS manual says to record the weight and reps lifted rather than calculate a 1RM[10]. Use this page to pick a starting load, not to replace a test.
Reading Your Result
The big number is the added weight for one rep. The total below it includes your bodyweight, and the multiple is that total divided by bodyweight, which is how Coyne reported relative strength[5].
The rep table gives the belt weight for sets of 1 to 10. It runs each equation backward from its own 1RM. No study tests that reverse use, so treat the lighter rows as estimates too.
Percentages apply to the total, not the belt
Say your total 1RM is 120 kg at 80 kg bodyweight, which is +40 kg. Eighty percent of that max is 96 kg, so you load +16 kg.
Taking 80% of the belt weight gives +32 kg. That is 93.3% of your max, which is much heavier than you meant. The calculator's percent table does it the first way, and marks any row below bodyweight as assisted.
What Counts as a Rep
The equations can only be as honest as your reps. The AIS testing manual gives clear rules for what it calls a chin-up, with either an overhand or underhand grip[10].
- Start from a hang with the elbows fully extended, then pull in one smooth action until the angle of your jaw is over the bar.
- Lower under control to full elbow extension. Legs can stay bent or straight, but can't move to build momentum.
- Grip no wider than one hand width outside the shoulders. A rep doesn't count if you swing, break at the hips or knees, stop short of full extension, or rest more than 3 seconds between reps.
The 2020 pull-up study used the same standard: full-arm hang to chin above the bar, overhand grip, controlled lowering[8]. Coyne's thesis controlled tempo and range of motion in its 1RM test[6].
Kipped or half reps make a set easier, so they would inflate the estimate. No source converts between grips, so compare sets only within one grip.
What Counts as Strong
The best measured pull-up numbers come from Coyne and colleagues. Their 15 adult male athletes, from recreational to international level, averaged a pull-up 1RM of 105.90 ± 17.78 kg including bodyweight, which was 1.43 ± 0.15× bodyweight[5].
Muñoz-López and colleagues report 1.5 ± 0.34 per kg of body mass in 82 resistance-trained men aged about 27[7]. The abstract does not say whether bodyweight sits inside that load, so it is a looser comparison than Coyne's.
One more reference point: in 29 strength-trained men who managed about 16 bodyweight reps, bodyweight alone was roughly 66 to 69% of their 1RM[8]. Those men were all strength-trained, so it is not a norm for everyone.
These are small groups of men, so they describe those men and not a standard. No sourced standards by bodyweight exist, so the calculator gives no beginner, intermediate or elite label.
What This Calculator Does Not Include
No source gives strength standards by bodyweight, a chin-up conversion, an assisted-pull-up load or a measured share of bodyweight for the pull-up. So there are no beginner-to-elite labels, no grip converter and no assistance mode.
What remains is bodyweight in the load, seven published equations, and the limits above.
For other lifts, see the dips 1RM calculator, the weighted calisthenics 1RM calculator or the 1RM calculator. For a rep-max check, try the 5RM calculator or the 3RM calculator.
Frequently Asked Questions
Sources & References
- Strength testing: predicting a one-rep max from reps-to-fatigue. Brzycki M. Journal of Physical Education, Recreation & Dance 64(1):88-90 (1993)
- The accuracy of prediction equations for estimating 1-RM performance in the bench press, squat, and deadlift. LeSuer DA, McCormick JH, Mayhew JL, Wasserstein RL, Arnold MD. Journal of Strength and Conditioning Research 11(4):211-213 (1997)
- Prediction of one repetition maximum strength from multiple repetition maximum testing and anthropometry. Reynolds JM, Gordon TJ, Robergs RA. Journal of Strength and Conditioning Research 20(3):584-592 (2006)
- Accuracy of prediction equations for determining one repetition maximum bench press in women before and after resistance training. Mayhew JL, Johnson BD, LaMonte MJ, Lauber D, Kemmler W. Journal of Strength and Conditioning Research 22(5):1570-1577 (2008)
- Reliability of pull up and dip maximal strength tests. Coyne JOC, Tran TT, Secomb JL, Lundgren L, Farley ORL, Newton RU, Sheppard JM. Journal of Australian Strength and Conditioning 23(4) (2015)
- Influence of anthropometric and upper body strength qualities on surfboard paddling kinematics (Master of Science thesis; the pull-up test method and load definition). Coyne J. Edith Cowan University (2015)
- Load-, force-, and power-velocity relationships in the prone pull-up exercise. Muñoz-López M, Marchante D, Cano-Ruiz MA, Chicharro JL, Balsalobre-Fernández C. International Journal of Sports Physiology and Performance 12(9):1249-1255 (abstract read; the load definition behind the 1.5 figure is not stated there) (2017)
- Effects of velocity loss during body mass prone-grip pull-up training on strength and endurance performance. Sánchez-Moreno M, Cornejo-Daza PJ, González-Badillo JJ, Pareja-Blanco F. Journal of Strength and Conditioning Research 34(4):911-917 (2020)
- Predicting 1RM or sub-maximal strength levels from simple "reps to fatigue" (RTF) tests (abstract read only; the year is not shown on the page). Baker D. Australian Strength and Conditioning Association
- National Protocols for the Assessment of Strength and Power, Version 3.0 (the PDF on this page; its revision table lists April 2025. The page text above the download still says Version 2. Sections used: 1.1 on predictive equations and 5.5 Chin Up). Australian Institute of Sport and the National Institute Network. Australian Sports Commission (2025)

Certified Personal Trainer & Sports Nutritionist
NASM-certified fitness and nutrition coach with over 10 years of hands-on experience helping people build strength, lose fat, and live healthier lives. Specializing in gym-based workouts with a strong focus on lifting technique, biomechanics, and practical exercise science. Through FitLifeRegime, sharing the tools, tips, and insights that have worked for hundreds of clients — helping you start your own fitness journey with confidence and clarity.
Learn more about Manish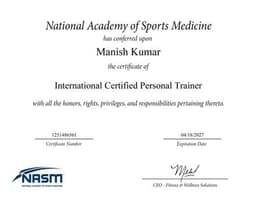
NASM Certified
Certified Personal Trainer & Sports Nutritionist from the National Academy of Sports Medicine
Disclaimer: This tool is for informational and personal journaling purposes only. Results are estimates based on published formulas and may vary based on individual factors such as genetics, training history, and measurement technique.