
Key Takeaways
- Heart rate recovery is your peak heart rate minus your heart rate one minute after you stop. A peak of 170 and 140 a minute later is 30 bpm.
- Studies have set cut-offs for that number, but they flag a higher risk of death in adults who had exercise tests. They do not grade your fitness.[1]
- Session load is session RPE × minutes. An hour at RPE 5 is 300 arbitrary units, useful against your own other sessions only.[7]
- Neither number can be turned into hours of recovery with a validated formula, so no hours figure is shown. Here is why.
How the Calculator Works
Two tabs, and each one uses a method with a published definition.
| Tab | How it is worked out | Basis |
|---|---|---|
| Heart rate recovery | Peak heart rate minus the reading at 1 minute, and at 2 minutes if you have it | Cole et al., Watanabe et al.[1][2][3] |
| Session load | Session RPE × minutes, plus the share of heart rate reserve if you add heart rate | Foster et al., Tanaka et al.[5][6][7] |
What each tab works out and where the method comes from. Source numbers match the sources list.
Your inputs stay in your browser. Each tab keeps its own, and nothing is sent anywhere.
How to Calculate Heart Rate Recovery
One subtraction, but how you take the readings changes what the answer means.
Heart rate recovery (HRR) is the fall in heart rate from the peak of exercise to a set time after you stop. The standard time is one minute, written HRR1. Some studies use two minutes, written HRR2.
Worked example: peak 170, then 140 at 1 minute and 120 at 2 minutes
HRR1 is 170 − 140 = 30 bpm, which is 17.6% of your peak. HRR2 is 170 − 120 = 50 bpm. 20 bpm of that fall came in the second minute.
After a light cool-down, an HRR1 of 12 bpm or less is the abnormal cut-off from the first study[1]. A peak of 170 and a reading of 160 gives 10 bpm, which is at or below it.
Take your peak at the moment you stop, not the highest number of the whole session, then start a timer. Do the same thing for the next minute every time you measure. The two cut-off studies recovered in different ways, one with a light cool-down and one lying down, and Daanen's review lists the effort before the reading as one thing that shifts the number[4].
That is why the tab asks how you recovered. If you stood or sat still, the studies did not set a cut-off for that, so the tab says so rather than borrowing one.
Heart Rate Recovery Chart: Published Cut-offs
Three cut-offs from three studies, each tied to how recovery was measured.
| Measure | Cut-off | Set-up in the study |
|---|---|---|
| HRR1[1] | 12 bpm | light cool-down after a symptom-limited exercise test |
| HRR1[3] | 18 bpm | lying on the left side with no cool-down, after an exercise echo test |
| HRR2[2] | 42 bpm | submaximal exercise test in adults without cardiovascular disease |
Published abnormal heart rate recovery cut-offs. A fall at or below the number was linked to a higher risk of death in that study.
These are risk markers, not fitness grades. In the first study, 2,428 adults (mean age 57) who were having a symptom-limited exercise test were followed for six years. Those with an HRR1 of 12 or less were about four times as likely to die as the others (relative risk 4.0), and about twice as likely after adjusting for age, sex, medication, resting heart rate, workload and other factors (adjusted 2.0)[1].
You will see charts online that rate heart rate recovery as "excellent", "good" or "poor" by age. None of the studies cited here publishes bands like that, so this page does not show any.
Daanen's systematic review found that heart rate recovery relates to training status, but that age, temperature, and the intensity and length of the exercise before it all shift the number. The authors asked for better standardisation, so the most useful comparison is your own readings taken the same way over time[4].
Session Load and Why There Is No Recovery-Hours Figure
A number for how big a session was, and the research on how long recovery took.
In the session RPE method, you rate the whole session on a 0 to 10 scale after it ends, answering one question: how hard was it overall[6]. Session load is that rating multiplied by the minutes, in arbitrary units[7].
Worked example: 60 minutes at RPE 5, average heart rate 150, resting 60, age 40
The load is 5 × 60 = 300 AU. Predicted maximum is 208 − 0.7 × 40 = 180 bpm[5].
Heart rate reserve used is (150 − 60) ÷ (180 − 60) = 75.0%. The prediction is a population average, so a measured maximum is better if you have one.
Load only means something against your own other sessions. It says nothing about how long you need to recover, and none of the cited studies links one to the other.
What does exist is measurements of recovery after specific sessions. Here are two open-access ones.
Full squats at 60% or 80% of one-rep max, stopping at 20% or 40% velocity loss[8]
- Who:
- 17 men
- Checked:
- Before, straight after, and at 6, 24 and 48 hours
- Found:
- Bar speed was still down at 6 hours after 60% with 20% velocity loss and at 24 hours after 80% with 40%. Jump height was still down at 24 hours after both 60% sessions. Higher velocity loss and the lighter load meant more fatigue and slower recovery.
Simulated half-marathon on a treadmill[9]
- Who:
- 36 recreational runners (19 women), mean age 28.5
- Checked:
- Before, straight after, day 1 and day 2
- Found:
- Most of the measures taken, including knee flexor and extensor torque, were back to baseline by day 1. Hip joint position sense took until day 2, and thigh muscle torque was above baseline by day 2.
Both studies tell you what happened to those people after those sessions. Neither is a rule for a different session, a different person, or a different week.
If you want something to compare against, repeat the same warm-up set or the same jump before each session and see how it sits against your own usual. The squat study tracked those same two things. For a training-load score with a defined formula, use the Training Stress Score calculator.
Recovery After Running and Lifting
What the two studies found, and how far it stretches.
Calculators that give "hours to recover" for a run or a ride usually apply multipliers for fitness, age and intensity. This page does not cite a study behind any of those, so it leaves them out.
For running, one study followed 36 recreational runners (mean age 28.5) after a simulated half-marathon on a treadmill. Most of the measures it took were back to baseline by day 1, but hip joint position sense took until day 2[9].
For lifting, 17 men did four different full-squat protocols. How long bar speed and jump height stayed down depended on the load and on how much speed was lost in the set[8]. The lighter load with 20% velocity loss was still affecting bar speed at 6 hours, while the heavier load taken to 40% loss was at 24 hours. Those are single protocols in a small sample.
To set the intensity of your next session by heart rate, use the target heart rate zones calculator. To rate it by effort, use the RPE load calculator.
Accuracy and Limits
What each number can and cannot tell you.
- The subtraction is exact. The result is only as good as your two readings, so use the same device and read it at the same moment each time.
- The 12 and 18 bpm cut-offs come from adults having clinical exercise tests, and each applies only to the way recovery was measured there. Using them on a healthy athlete after a hard interval session is outside what was studied.
- The 2-minute cut-off comes from a population study of adults without cardiovascular disease who did a submaximal test[2]. Its abstract does not say how they recovered, so the calculator shows that row as background rather than a match for your set-up.
- Session RPE is a rating, so it depends on how you score it. Use the same anchors every time, and compare only with your own sessions.
- The age-based maximum is an average for healthy adults, so your own maximum can sit above or below it. It was built from adult data, so results for under-18s carry a note.
- Medicines that act on the heart change heart rate, and Daanen's review lists temperature among the things that shift heart rate recovery[4]. This page does not adjust for either.
- This is an educational tool. It is not a diagnosis. A low heart rate recovery, chest pain, dizziness or fainting is a reason to speak to a doctor, not to use a calculator.
Frequently Asked Questions
Sources & References
- Heart-rate recovery immediately after exercise as a predictor of mortality. Cole CR, Blackstone EH, Pashkow FJ, Snader CE, Lauer MS. N Engl J Med 341(18):1351-1357 (1999)
- Heart rate recovery after submaximal exercise testing as a predictor of mortality in a cardiovascularly healthy cohort. Cole CR, Foody JM, Blackstone EH, Lauer MS. Ann Intern Med 132(7):552-555 (2000)
- Heart rate recovery immediately after treadmill exercise and left ventricular systolic dysfunction as predictors of mortality: the case of stress echocardiography. Watanabe J, Thamilarasan M, Blackstone EH, Thomas JD, Lauer MS. Circulation 104(16):1911-1916 (2001)
- A systematic review on heart-rate recovery to monitor changes in training status in athletes. Daanen HAM, Lamberts RP, Kallen VL, Jin A, Van Meeteren NL. Int J Sports Physiol Perform 7(3):251-260 (2012)
- Age-predicted maximal heart rate revisited. Tanaka H, Monahan KD, Seals DR. J Am Coll Cardiol 37(1):153-156 (2001)
- A new approach to monitoring exercise training. Foster C, Florhaug JA, et al.. J Strength Cond Res 15(1):109-115 (2001)
- Session-RPE method for training load monitoring: validity, ecological usefulness, and influencing factors. Haddad M, Stylianides G, Djaoui L, et al.. Front Neurosci 11:612 (2017)
- Time Course of Recovery Following Resistance Exercise with Different Loading Magnitudes and Velocity Loss in the Set. Pareja-Blanco F, Villalba-Fernández A, Cornejo-Daza PJ, et al.. Sports 7(3):59 (2019)
- Biomechanical Changes and the Time Course of Recovery in Lower Extremities of Recreational Runners Following a Simulated Treadmill Half-Marathon. Wang W, Xu S, Komnik I, et al.. Sports Med Open 11:22 (2025)

Certified Personal Trainer & Sports Nutritionist
NASM-certified fitness and nutrition coach with over 10 years of hands-on experience helping people build strength, lose fat, and live healthier lives. Specializing in gym-based workouts with a strong focus on lifting technique, biomechanics, and practical exercise science. Through FitLifeRegime, sharing the tools, tips, and insights that have worked for hundreds of clients — helping you start your own fitness journey with confidence and clarity.
Learn more about Manish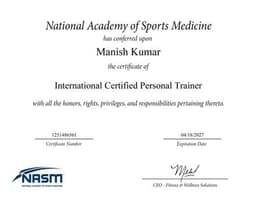
NASM Certified
Certified Personal Trainer & Sports Nutritionist from the National Academy of Sports Medicine
Disclaimer: This calculator is for informational and personal journaling purposes only. It logs measurements and compares them to published reference values. It is not health, medical, or nutrition advice.