
Key Takeaways
- Training stress score (TSS) puts time and intensity into one number. One hour at your threshold scores 100, and the score rises with the square of intensity[1][2].
- TrainingPeaks calls power-based TSS the most accurate and running TSS the second most accurate[2]. The run score here is a simpler estimate, the swim method is called rough by its authors, and the no-power estimate is only as good as your effort rating[3][4][5].
- CTL, ATL and TSB turn daily TSS into a fitness average (42 days), a fatigue average (7 days) and the gap between them[6][8].
- Every score is measured against your threshold. A threshold that is too low makes every score too high, so keep it current.
How TSS Is Worked Out
One idea, three sports. Each sport uses its own measure of intensity.
| Sport | Intensity factor (IF) | Score | Status |
|---|---|---|---|
| Bike (power) | NP / FTP | hours × IF² × 100 | Published formula[1][2] |
| Run (pace) | Threshold pace / pace (a speed ratio) | hours × IF² × 100 | Estimate. Not TrainingPeaks' full rTSS[3] |
| Swim (pace) | Swim speed / threshold speed | hours × IF³ × 100 | Published, called rough by its authors[4] |
| No power meter | Not used | TSS per hour for the effort × hours | Published estimate table[5] |
The formulas this tool uses. Source numbers match the sources list.
The cycling formula is built so that one hour at your FTP scores exactly 100[2]. Riding at half that intensity for an hour scores 25, because IF is squared.
Worked example: bike
Normalized power is not the same as average power. It weights hard efforts more, so use the figure from your head unit or training site, or work it out from a ride file with the Cycling NP, IF and TSS Calculator.
Run and Swim Scores
Pace-based versions, with different levels of support.
TrainingPeaks works out its running score from normalized graded pace against your threshold pace, the fastest pace you could hold for about an hour[3]. It also says the calculation allows for a pace being more stressful the longer it is held.
I could not find that allowance published. So the run mode here uses the simple structure only (IF squared, times the hours, times 100) and labels the result an estimate. Your platform's number can differ.
The swim method is published in full. It cubes IF instead of squaring it, because water resists more as speed rises[4]. It uses moving time only, so leave rests out.
Worked example: swim
The same article lists what the swim method leaves out: the effect of rests, differences between strokes and technique, and the effect of turns and push-offs[4]. It also describes two ways to find a swim threshold, a timed swim of 30 or 60 minutes or a 200 m and 400 m critical speed test.
No Power Meter: Estimating From Effort
A fallback from Joe Friel, for when you have no power meter.
Friel's article estimates TSS per hour from your rating of perceived exertion (RPE) or average heart-rate zone[5]. You multiply the TSS per hour by the hours.
| RPE | Heart-rate zone | TSS per hour |
|---|---|---|
| 1 | Zone 1 (low) | 20 |
| 2 | Zone 1 | 30 |
| 3 | Zone 1 (high) | 40 |
| 4 | Zone 2 (low) | 50 |
| 5 | Zone 2 (high) | 60 |
| 6 | Zone 3 | 70 |
| 7 | Zone 4 | 80 |
| 8 | Zone 5a | 100 |
| 9 | Zone 5b | 120 |
| 10 | Zone 5c | 140 |
TSS per hour by effort, from the table in Friel's article.
The article's examples match the table. Thirty minutes at RPE 6 scores 35, and 90 minutes at high zone 2 scores 90.
A session of 15 minutes in high zone 1, 30 minutes in zone 5a and 15 minutes in low zone 1 adds up to 65[5].
Friel calls RPE and average heart rate "far from perfect" but close enough if you use the same method each time[5]. TrainingPeaks says heart-rate TSS is quite accurate for steady efforts and less so when effort swings a lot[2].
The article does not say how to set your heart-rate zones, so use the system you already train with.
A whole workout longer than an hour cannot be at 100 TSS per hour or more, since an hour at threshold is 100. Only part of it can. The tool warns you if you try[5].
CTL, ATL and TSB: Your Training Load Over Time
Daily TSS turned into fitness, fatigue and form.
CTL (chronic training load, or fitness) is an exponentially weighted average of daily TSS, with a default time constant of 42 days[8]. ATL (acute training load, or fatigue) is the same average over 7 days[6].
Each day, the new value moves a set fraction of the way toward that day's TSS. For ATL, TrainingPeaks gives the formula as yesterday's ATL plus (today's TSS minus yesterday's ATL) times 1/7. CTL works the same way with 42[6].
Form (TSB) is yesterday's CTL minus yesterday's ATL[7]. A positive number means fresh, near zero means adapted to your current load, and negative means not adapted to it[7].
Worked example: one rest day
TrainingPeaks says form is not a predictor of performance but a measure of how adapted you are to your training load[7][8].
Its general rule of thumb is slightly negative up to positive 25, and it says no single form works for every athlete. A form that gets too high may mean you tapered too much and lost fitness[9].
Coggan adds a rougher guide. Below −10 you usually do not feel very fresh, above +10 you usually do, and −10 to +10 is neutral. He says not to apply those numbers too literally[8].
Coggan also warns that raising CTL by more than about 5 to 7 points a week for four weeks or more often leads to illness or signs of overreaching[8].
If you have no history to start from, he suggests giving CTL and ATL the same starting value and reading the numbers cautiously at first[8].
Reading Your Score
Published reference values for power. They describe typical sessions and are approximate.
| IF | Typical for |
|---|---|
| Under 0.75 | Recovery rides |
| 0.75 to 0.85 | Endurance-paced training rides |
| 0.85 to 0.95 | Tempo rides, aerobic and anaerobic interval workouts (work and rest combined), longer road races (over 2.5 h) |
| 0.95 to 1.05 | Lactate threshold intervals (work period only), shorter road races (under 2.5 h), criteriums, circuit races, longer time trials (such as 40 km) |
| 1.05 to 1.15 | Shorter time trials (such as 15 km), track points race |
| Over 1.15 | Prologue time trial, track pursuit, track miss-and-out |
Typical IF values for different sessions or races (TrainingPeaks, Coggan).
One note from the same source: an IF above 1.05 in a race of about an hour often means the FTP you entered is lower than your real one[1].
| TSS for a ride | Level | What TrainingPeaks says |
|---|---|---|
| Under 150 | Low | Recovery generally complete by the following day |
| 150 to 300 | Medium | Some residual fatigue may be present the next day, but gone by the 2nd day |
| 300 to 450 | High | Some residual fatigue may be present even after 2 days |
| Over 450 | Very high | Residual fatigue lasting several days likely |
TSS for a single ride as an approximate guide to recovery (TrainingPeaks, Coggan). Published for power.
I found this scale published for power only. I did not find a statement that it applies to a run or a swim, so the tool shows it for bike scores and not for the others.
| IF | 30 min | 1 h | 90 min | 2 h | 3 h | 4 h |
|---|---|---|---|---|---|---|
| 0.60 | 18 | 36 | 54 | 72 | 108 | 144 |
| 0.70 | 24 | 49 | 73 | 98 | 147 | 196 |
| 0.80 | 32 | 64 | 96 | 128 | 192 | 256 |
| 0.90 | 41 | 81 | 122 | 162 | 243 | 324 |
| 1.00 | 50 | 100 | 150 | 200 | 300 | 400 |
TSS by ride time and IF, calculated from hours × IF² × 100. These are results of the formula, not published reference values.
Recovery depends on much more than one number: sleep, food, the rest of your week and how you feel. Let how you feel overrule the scale.
Limits and What Is Left Out
Worth knowing before you lean on the numbers.
- Your threshold drives everything. Every score is measured against the threshold you enter. Coggan gives an example: an FTP of 240 W instead of 250 W raises the TSS of the same workout by just over 8%[8]. To find yours, try the FTP Calculator.
- Compare within a sport. I found nothing published that says 100 TSS in running or swimming is the same stress as 100 on the bike, so do not add or compare them as if they were equal.
- Short rides. TrainingPeaks says to ignore normalized power for periods under roughly 10 minutes[10]. Another Help Center article says it is generally not valid under 20 minutes[11]. The bike mode warns you in both cases.
- What goes in. The score is built from time and intensity only. Sleep, food, heat, altitude and life stress are not inputs.
- What TSS measures. TrainingPeaks says TSS was modelled after Dr. Eric Bannister's heart-rate-based training impulse (TRIMP)[1][2], and that it may be best viewed as a predictor of the glycogen used in a workout[1]. That is TrainingPeaks' own description and I did not check the glycogen claim elsewhere. Treat TSS as a useful bookkeeping number, not a lab measurement.
- Who it applies to. I found no published age, sex or body-composition limits for TSS, and I have not invented any. If you are new to training or returning from a break, use the numbers as a log, not a target.
- Left out on purpose. I did not include weekly TSS targets. I found none published by TrainingPeaks, and the figures on other sites had no source behind them. I also left out Coggan's observation that a CTL of 100 to 150 felt "optimal" to experienced power-meter athletes. He puts optimal in quotes, and it is not a target for most people[8].
- The training-load model. It only knows the days you enter and the starting CTL and ATL you give it. Missing days are not filled in, and a start of 0 and 0 models a person who had not been training.
- Tool limits. The tool accepts an FTP of 50 to 600 W, NP of 20 to 2,000 W, run paces of 2:00 to 15:00 per km, swim paces of 0:40 to 5:00 per 100, sessions of 1 minute to 24 hours, and daily TSS of 0 to 1,000 for up to 180 days. These are limits of this tool to catch typing errors, not published rules.
Training Stress Score, TSS, Normalized Power, NP, Intensity Factor and IF are marks of TrainingPeaks, LLC. This page is not affiliated with or endorsed by TrainingPeaks. It uses the published calculations.
Frequently Asked Questions
Sources & References
- Normalized Power, Intensity Factor and Training Stress Score. Coggan A. TrainingPeaks Learn (updated 11 May 2026)
- Training Stress Scores (TSS) Explained. TrainingPeaks. TrainingPeaks Help Center (dated 29 May 2025)
- Running Training Stress Score (rTSS) Explained. McGregor S. TrainingPeaks Learn (updated 13 April 2026)
- Calculating Swimming TSS Score. Fitzgerald M, McGregor S. TrainingPeaks Learn (updated 11 April 2026)
- Estimating Training Stress Score (TSS). Friel J. TrainingPeaks Learn (updated 13 April 2026)
- Fatigue (ATL). TrainingPeaks. TrainingPeaks Help Center (dated 24 August 2026)
- Form (TSB). TrainingPeaks. TrainingPeaks Help Center (dated 24 October 2022)
- The Science of the TrainingPeaks Performance Manager. Coggan A. TrainingPeaks Learn (updated 31 October 2023)
- What is the Performance Management Chart?. TrainingPeaks. TrainingPeaks Learn (updated 5 October 2026)
- Normalized Power. TrainingPeaks. TrainingPeaks Help Center
- Why is my normalized power lower than my average power?. TrainingPeaks. TrainingPeaks Help Center

Certified Personal Trainer & Sports Nutritionist
NASM-certified fitness and nutrition coach with over 10 years of hands-on experience helping people build strength, lose fat, and live healthier lives. Specializing in gym-based workouts with a strong focus on lifting technique, biomechanics, and practical exercise science. Through FitLifeRegime, sharing the tools, tips, and insights that have worked for hundreds of clients — helping you start your own fitness journey with confidence and clarity.
Learn more about Manish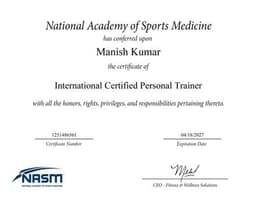
NASM Certified
Certified Personal Trainer & Sports Nutritionist from the National Academy of Sports Medicine
Disclaimer: This calculator is for informational and personal journaling purposes only. It logs measurements and compares them to published reference values. It is not health, medical, or nutrition advice.