
Key Takeaways
- Cadence is steps per minute, both feet. Count the steps in 30 seconds and double it, or count one foot for 30 seconds and multiply by four.
- Cadence rises with speed. In 256 runners who shared watch data, it went up by about 6 steps per minute for every extra metre per second[1].
- No source I found gives one right cadence for everyone. At 3.0 m/s (5:33 per km), that group's line gives about 168[1], and a lab study of 14 runners found an average optimum of about 170 steps[5].
- A 5 to 10% rise in cadence at the same speed lowered some joint loading in a lab[2]. That is not the same as preventing injuries, and I say where the evidence stops.
How to Count Your Running Cadence
A stopwatch is enough.
- Run at a steady pace for a minute or so, so you are not still settling in.
- Count every time a foot lands, left and right, for 30 seconds. Double it to get steps per minute.
- If you only counted one foot, multiply by four for 30 seconds, or by two for 60 seconds. The calculator does this when you choose "One foot only".
Your watch will usually show cadence for you. Check whether it says steps or strides, because research papers often use strides, and a stride is two steps.
Hand counts can run high. In a treadmill study of 30 runners, a researcher's 30-second count came out higher than the treadmill's own measure at every speed, and the paper does not say by how much[8].
Worked example
Count at a few speeds if you can. Cadence changes with pace, so one number from an easy run does not describe your tempo run.
What Cadence Do Runners Use at Different Speeds?
One large dataset, and what it can and cannot tell you.
Van Oeveren and colleagues analysed Garmin watch data from 256 runners recruited online in the Netherlands. They found stride frequency rose with speed as SF = 75.01 + 3.006 × V, with V in metres per second[1].
SF counts strides, and a stride is two steps. Doubled, the relation is steps per minute = 150.02 + 6.012 × V. It was fitted over 1.64 to 4.68 m/s, which is 5.9 to 16.8 km/h.
| Pace per km | Pace per mile | Speed (km/h) | Steps per minute |
|---|---|---|---|
| 7:30 | 12:04 | 8.0 | 163 |
| 7:00 | 11:16 | 8.6 | 164 |
| 6:30 | 10:28 | 9.2 | 165 |
| 6:00 | 9:39 | 10.0 | 167 |
| 5:30 | 8:51 | 10.9 | 168 |
| 5:00 | 8:03 | 12.0 | 170 |
| 4:30 | 7:15 | 13.3 | 172 |
| 4:00 | 6:26 | 15.0 | 175 |
| 3:45 | 6:02 | 16.0 | 177 |
Typical cadence by pace, from the Van Oeveren 2019 group relation
At group level, speed alone explained about 42% of the variation (adjusted R² 0.419). In the fuller models, which add things like leg length and training habits, about half the variance was still unexplained differences between individuals[1].
The group was 85.5% men and averaged 44.1 years and 181.4 cm. The study also found older runners used a slightly higher cadence at faster speeds, about 1.4 steps per minute more at 3 m/s for a 40-year-old than a 30-year-old[1]. The calculator does not adjust for this.
The authors note their cadences are higher than earlier studies at the same speed, and that speed came from GPS. A GPS error of 0.4 m/s, which they say is possible in extreme conditions, would lower the line by about 4 steps per minute. They expect the real error is smaller[1].
| Study | Who | What it found |
|---|---|---|
| Van Oeveren 2019[1] | 256 runners, watch data | About 6.0 steps per minute for each 1 m/s. 166 at 2.68 m/s, 173 at 3.83 m/s |
| Burns 2019[7] | 20 elite 100 km runners | 5.6 steps per minute for each 1 m/s. Race average 182.0, range 155.4 to 203.1 |
| Leacox 2025[8] | 30 experienced runners on a treadmill, 21 to 49 years | 169.2 at 2.68 m/s to 177.9 at 3.83 m/s, about 7.6 per 1 m/s |
Three studies of cadence and speed
The three agree on direction and roughly on size. At the Leacox speeds the group relation gives 166 and 173, a few steps under the treadmill means, so the exact level depends on who and how you measure.
Not everyone follows the trend. In the Leacox group, eight of 30 runners changed cadence by four steps per minute or less from the slowest to the fastest speed[8]. They lengthened their step instead.
Does Height Change Your Cadence?
Probably, but I cannot give you a number.
Several studies find that taller runners, or runners with longer legs, use a lower cadence. In the Van Oeveren data, each 5 cm of extra leg length went with about 2 fewer strides per minute, which is 4 steps, and each 15 kg of extra body mass with about 1 fewer stride[1].
Burns found cadence fell by 123.1 steps per minute for each extra metre of height in elite 100 km runners[7]. Tenforde found a moderate link between leg length and cadence in 82 recreational runners (r = 0.449)[9].
Cavanagh and Kram found little link in male recreational runners on a treadmill at 3.15 to 4.12 m/s. Body measures such as stature and leg length correlated with preferred stride length and frequency at 0.36 or less, not significantly different from zero[6].
Why there is no height chart here
Is 180 Steps per Minute the Right Number?
It is a famous number with a narrow origin.
The 180 figure is credited to Jack Daniels counting elite runners at the 1984 Olympics[11]. Runner's World quotes Pete Larson, an exercise physiologist, saying Daniels actually wrote "180 steps or more per minute"[10].
I read this second-hand and did not check Daniels' own text.
The data back up the "or more". The elite 100 km runners averaged 182.0 but ranged from 155.4 to 203.1[7]. At 3.0 m/s the Van Oeveren line gives 168, so 180 sits above it at that speed[1].
Lieberman's group had 14 runners run at 3.0 m/s with stride rates from 75 to 95 per minute. The average metabolically best rate was 84.8 strides, about 170 steps[5].
So 180 describes some runners at some speeds. These studies do not show it is the right number for everyone at every pace.
Trying a Higher Cadence
What the studies tested, and what they did not.
Heiderscheit and colleagues had 45 healthy recreational runners run on a treadmill at constant speed with step rate at preferred, plus or minus 5%, and plus or minus 10%. At +5% and +10% the knee absorbed less energy, and the hip did at +10%[2].
Step length, vertical movement of the centre of mass and braking impulse fell as step rate rose. At −10%, every joint absorbed more energy[2].
A 2014 review of 10 studies found a higher stride rate at constant speed consistently lowered several loading measures. Most studies were small and used male runners[3].
A 2025 review of 18 studies found a 5 to 10% increase gave consistent biomechanical changes without harming metabolic cost. It says better long-term studies are needed[4].
- Start from your own cadence at the speed you will practise, and try +5% first, the smaller of the two tested changes.
- The 2025 review found that auditory cues helped people keep to the new rate[4]. A metronome app is one way to do that.
- I found no source for a safe weekly schedule, so go gently and stop if something hurts.
To see what a change does to your step, the Cadence and Stride Calculator solves speed, cadence and step length from any two.
Limits and What Is Left Out
What this page does not claim.
- The typical-cadence line describes one group of mostly male watch users recruited in the Netherlands. It is not a standard for you, and I found no published range for a single runner.
- Watch cadence is itself an estimate. The study's authors say accuracy can vary with the watch and sensor setup[1].
- Heiderscheit's study and the 2014 review measured joint loading and other mechanics, not injuries. The 2025 review says the evidence suggests a preventive effect for some injuries and asks for more long-term studies[4].
- The earlier version of this page guessed a stride length from your speed, then adjusted it for height, sex, age, experience and BMI. It also listed cadence ranges by runner level and a schedule of 5% steps every 2 to 3 weeks. I found no source for any of these, so they are removed.
- It also described Schubert 2014 as an analysis of 53 recreational runners. That paper is a systematic review of 10 studies[3].
- There is no terrain, fatigue or injury-risk output, because I found no source I could use for them. For pace splits, try the Running Split Calculator or the Treadmill Pace Calculator.
Frequently Asked Questions
Sources & References
- Inter-individual differences in stride frequencies during running obtained from wearable data. Van Oeveren BT, De Ruiter CJ, Hoozemans MJM, Beek PJ, Van Dieën JH. Journal of Sports Sciences 37(17):1996-2006 (2019)
- Effects of step rate manipulation on joint mechanics during running. Heiderscheit BC, Chumanov ES, Michalski MP, Wille CM, Ryan MB. Medicine & Science in Sports & Exercise 43(2):296-302 (2011)
- Influence of stride frequency and length on running mechanics: a systematic review. Schubert AG, Kempf J, Heiderscheit BC. Sports Health 6(3):210-217 (2014)
- The Influence of Running Cadence on Biomechanics and Injury Prevention: A Systematic Review. Figueiredo I, Reis E Silva M, Sousa JE. Cureus 17(8):e90322 (abstract) (2025)
- Effects of stride frequency and foot position at landing on braking force, hip torque, impact peak force and the metabolic cost of running in humans. Lieberman DE, Warrener AG, Wang J, Castillo ER. Journal of Experimental Biology 218(21):3406-3414 (2015)
- Stride length in distance running: velocity, body dimensions, and added mass effects. Cavanagh PR, Kram R. Medicine & Science in Sports & Exercise 21(4):467-479 (1989)
- Step frequency patterns of elite ultramarathon runners during a 100-km road race. Burns GT, Zendler JM, Zernicke RF. Journal of Applied Physiology 126(2):462-468 (abstract) (2019)
- The Effect of Running Speed on Cadence and Running Kinetics. Leacox A, Fashingbauer L, Ferguson T, Zajakowski A, Baum B, Reinking M. International Journal of Sports Physical Therapy 20(7):957-963 (2025)
- Is Cadence Related to Leg Length and Load Rate?. Tenforde AS, Borgstrom HE, Outerleys J, Davis IS. Journal of Orthopaedic & Sports Physical Therapy 49(4):280-283 (2019)
- The Great Cadence Debate. Runner's World. runnersworld.com (secondary source, quotes Jack Daniels)
- Why Cadence Matters for Running. Runner's World. runnersworld.com (secondary source, origin of the 180 figure) (2025)

Certified Personal Trainer & Sports Nutritionist
NASM-certified fitness and nutrition coach with over 10 years of hands-on experience helping people build strength, lose fat, and live healthier lives. Specializing in gym-based workouts with a strong focus on lifting technique, biomechanics, and practical exercise science. Through FitLifeRegime, sharing the tools, tips, and insights that have worked for hundreds of clients — helping you start your own fitness journey with confidence and clarity.
Learn more about Manish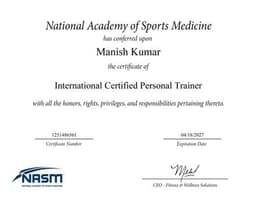
NASM Certified
Certified Personal Trainer & Sports Nutritionist from the National Academy of Sports Medicine
Disclaimer: This calculator is for informational and personal journaling purposes only. It logs measurements and compares them to published reference values. It is not health, medical, or nutrition advice.