
Key Takeaways
- Your bench press 1RM is the heaviest weight you can press once with form you would accept in a max. This page estimates it from a set of 1 to 10 reps taken to failure, using seven published equations[2].
- The equations disagree. For 135 lb for 10 reps they give 169 to 182 lb, so the page shows the average and the full range.
- In LeSuer's comparison of all seven on the bench press, only Mayhew and Wathan did not differ significantly from the measured max. The other five read low by roughly 1 to 6%[2]. The students were untrained, so read that as a direction, not a promise.
- A set of exactly 5 reps also gets a second, bench-only estimate from Reynolds[3]. The Australian Institute of Sport warns of large variability (±10%) when a max is predicted from submaximal reps, and says not to log a prediction as a 1RM[7].
How to Calculate Your Bench Press Max
Warm up, then do one hard bench set with a spotter and stop when you can't finish another rep with good form. Enter the weight and the reps. Each equation turns your reps into a multiplier, and your 1RM is the weight times that multiplier.
What happens when you press Calculate
- The seven equations each turn your reps into a multiplier[2].
- The page shows the lowest, the highest and the plain average of the seven results.
- At exactly 5 reps to failure, the Reynolds bench equation gives a second estimate[3].
- If the set stopped short of failure, pick an RPE and the page reads the Helms chart instead, which covers 1 to 8 reps[8].
Worked example: if I can bench 135 lb for 10 reps
Epley: 135 × (1 + 0.0333 × 10) = 180 lb
Brzycki: 135 × 100 ÷ (102.78 − 2.78 × 10) = 180 lb
Ten reps is the edge of what the equations were built for. Brzycki says his is only valid under about 10 reps[1], and Reynolds says to use no more than 10 in linear equations[3]. In Reynolds' data a 5RM predicted the 1RM better than a 10RM or 20RM[3].
Brzycki's own paper has a worked table, and 225 lb for 10 reps comes out at about 300 lb[1]. His equation in this calculator gives 300.1 lb for that set.
Bench Press Max Chart: Weight and Reps to 1RM
Find the weight you lifted and the reps you did. Each cell is the average of the seven equations, so the true range is wider. For any weight in between, scale a nearby row.
| Weight lifted (lb) | 3 reps | 5 reps | 8 reps | 10 reps |
|---|---|---|---|---|
| 95 | 104 | 110 | 119 | 125 |
| 135 | 148 | 156 | 168 | 177 |
| 155 | 169 | 179 | 193 | 203 |
| 185 | 202 | 214 | 231 | 242 |
| 205 | 224 | 237 | 256 | 269 |
| 225 | 246 | 260 | 281 | 295 |
| 245 | 268 | 283 | 306 | 321 |
| 275 | 301 | 318 | 343 | 360 |
| 315 | 344 | 364 | 393 | 413 |
Estimated bench press 1RM in lb. Average of seven equations for a set taken to failure.
| Weight lifted (kg) | 3 reps | 5 reps | 8 reps | 10 reps |
|---|---|---|---|---|
| 40 | 43.7 | 46.2 | 49.9 | 52.4 |
| 50 | 54.7 | 57.7 | 62.4 | 65.5 |
| 60 | 65.6 | 69.3 | 74.8 | 78.6 |
| 70 | 76.5 | 80.8 | 87.3 | 91.7 |
| 80 | 87.4 | 92.4 | 99.8 | 104.8 |
| 90 | 98.4 | 103.9 | 112.2 | 117.9 |
| 100 | 109.3 | 115.5 | 124.7 | 131 |
| 120 | 131.2 | 138.6 | 149.7 | 157.3 |
The same chart in kg.
These numbers are arithmetic on the equations, not measured maxes. Use the calculator for a range, a warning check and loads at each percentage.
The Bench Press Formulas
LeSuer and colleagues print all seven in their Table 1[2]. In the table, w is the weight lifted and r is the reps to fatigue. The last two columns show each one for 225 lb lifted 5 times.
| Equation | Form | Multiplier at 5 reps | 1RM (lb) | Source |
|---|---|---|---|---|
| Epley | 1RM = w × (1 + 0.0333 × r) | × 1.167 | 262.5 | Epley, 1985 (workout chart) |
| Brzycki | 1RM = 100 × w ÷ (102.78 − 2.78 × r) | × 1.125 | 253.2 | Brzycki, 1993 |
| Lander | 1RM = 100 × w ÷ (101.3 − 2.67123 × r) | × 1.137 | 255.8 | Lander, 1985 |
| Lombardi | 1RM = w × r^0.1 | × 1.175 | 264.3 | Lombardi, 1989 |
| Mayhew | 1RM = 100 × w ÷ (52.2 + 41.9 × e^(−0.055 × r)) | × 1.190 | 267.8 | Mayhew et al., 1992 |
| O'Conner | 1RM = w × (1 + 0.025 × r) | × 1.125 | 253.1 | O'Conner et al., 1989 |
| Wathan | 1RM = 100 × w ÷ (48.8 + 53.8 × e^(−0.075 × r)) | × 1.166 | 262.3 | Wathan, 1994 |
Seven published equations, applied to 225 lb for 5 reps.
The Mayhew formula is 1RM = 100 × w ÷ (52.2 + 41.9 × e^(−0.055 × r)), and it gives 267.8 lb here. LeSuer notes that some of these were first published as a percentage of 1RM and were turned into 1RM equations for the comparison[2].
The sources above come from LeSuer's reference list. Brzycki's equation comes from his own paper[1], and the other six are taken as LeSuer printed them.
The average of all seven is 259.9 lb, with a range of 253.1 to 267.8 lb. The studies cited here do not test that average, so the range is the more honest answer.
A Bench-Only Check From Your 5RM
Reynolds and colleagues tested 70 adults aged 18 to 69 on the flat barbell bench press and measured their 1, 5, 10 and 20RM. They fitted a line from the 5RM to the 1RM[3].
1RM (kg) = 1.1307 × 5RM (kg) + 0.6999
Standard error of the estimate: 2.98 kg
Worked example: 225 lb for 5 reps to failure
225 lb = 102.06 kg
1.1307 × 102.06 + 0.6999 = 116.10 kg
116.10 kg = 256 lb
The same paper reports R² of 0.993 for a 5RM, 0.976 for a 10RM and 0.955 for a 20RM on the bench press[3]. A shorter set predicted the 1RM better, which matches the advice to use heavier sets.
The calculator shows this estimate only when the set is exactly 5 reps to failure, because that is the set the line was fitted to.
How Accurate Is a Bench Press 1RM Estimate?
Here is what each source looked at, so you can judge how far to trust the number you get:
| Source | What it found | Limit |
|---|---|---|
| LeSuer et al., 1997[2] | 67 untrained college students did a bench 1RM and a set of 10 or fewer reps to fatigue. All seven equations correlated highly with the measured max (r above 0.95). Only Mayhew and Wathan did not differ significantly from it, and the other five read low by roughly 1 to 6%. | Untrained students, so it may not describe a trained lifter. |
| Reynolds et al., 2006[3] | R² of 0.993, 0.976 and 0.955 for predicting the bench 1RM from a 5, 10 or 20RM. The standard error from a 5RM was 2.98 kg. The authors say to use no more than 10 reps in linear equations. | Flat barbell bench press. It fitted its own lines from measured data. |
| Mayhew et al., 2008[4] | 103 young women did bench press tests before and after 12 weeks of training. Prediction equations were more accurate when fewer than 10 reps to fatigue were used. | Young women, bench press only. |
| Kemmler et al., 2006[5] | 70 trained postmenopausal women (mean age 57.4) did four machine exercises, one of them a bench press machine. The authors' own cubic equation missed the measured 1RM by 1.5 to 3.1% on average across the four. | One group, on machines. The seven equations here were not tested on it, and the result is not bench-specific. |
| Australian Institute of Sport, 2022[7] | Its testing manual says predictive equations should not be used to calculate a 1RM, and that there can be large variability (±10%) when submaximal reps are used. It says to record the weight and reps actually lifted. | A testing manual, not an experiment. The ±10% comes from a 1992 study (Braith et al.). |
The studies above covered adults aged 18 to 69, so the calculator shows a warning for ages outside that range. They used a flat barbell or a bench press machine, and they do not cover dumbbell, incline or Smith machine presses.
None of the sources gives a correction factor for the low readings, so the page leaves the equations as published.
How Many Reps at a Given Percent of Your Max?
Nuzzo and colleagues pooled 952 reps-to-failure tests from 269 studies, covering 7,289 people and many exercises, to estimate how many reps people complete at each percentage of 1RM. The bench press was the most studied exercise, so it got its own table[6].
For the bench press, the average is 14.1 reps at 70% (95% confidence interval 12.4 to 16.1) and 8.8 at 80% (7.7 to 10.1). The paper's text gives about 4 at 90%, with no interval.
| % of 1RM | Load for a 225 lb max | Average reps to failure |
|---|---|---|
| 70% | 157.5 lb | 14.1 (12.4 to 16.1) |
| 80% | 180 lb | 8.8 (7.7 to 10.1) |
| 90% | 202.5 lb | about 4 |
Average reps to failure on the bench press, with loads for a 225 lb 1RM as an example.
These are averages. The interval shows how well the average is known, not how much one person can differ from it. The paper also reports the spread between individuals, and those values are not reproduced here, so treat the table as typical, not exact.
The authors found little influence of sex, age or training status on this relationship[6].
If You Test a True Bench 1RM
The Australian Institute of Sport manual, version 2.0 (effective July 2022), has a bench press protocol written for athlete testing[7]. After you calculate, the test-day card under the results turns its warm-up percentages into loads for your estimate.
- Warm-up. 5 minutes on an ergometer, then four bench sets at 40 to 60%, 60 to 70%, 70 to 80% and 90% of the predicted max. The last set is 1 to 3 reps. Rest is 2 minutes or more after the first three sets and 2 to 5 minutes after the last.
- Attempts. If a lift goes well, add weight in steps like 95%, 97.5%, 100% and 105% of the predicted load until you reach a max, with 2 to 5 minutes of rest between attempts.
- Technical violations. The manual lists three: failing to touch the chest or bouncing the bar off it excessively, lifting the shoulders, back or buttocks off the bench, and a foot leaving the floor. It calls such a trial invalid, and also says the test is concluded once a violation is observed.
- Spotters and recording. It recommends two experienced spotters, especially for maximal efforts, with one at each end of the bar. The weight of the bar, plates and collars all counts, and the result is recorded to the nearest 0.5 kg.
- Grip. You choose your grip width, and it should stay the same across attempts and between tests.
- Readiness. It suggests no severe training-induced fatigue in the 72 hours before, and at least 6 sessions of practising the lift beforehand.
The manual advises against logging a predicted number as a 1RM[7]. To go the other way, from a known 1RM to a 5 or 3 rep load, use the 5 Rep Max Calculator or the 3 Rep Max Calculator. The One Rep Max Calculator covers the squat and deadlift too.
What This Page Does Not Cover
- Strength levels such as beginner or advanced. No peer-reviewed bench press norm was used. The only comparison offered is your 1RM divided by your bodyweight, as plain division.
- Dumbbell, incline and Smith machine presses. The cited studies do not cover them. For dumbbells, enter the weight in one hand and read the result as per hand.
- Training programs and percentages for a goal. The sources give no single set of ranges for strength, size or endurance. For a planned ascending or descending bench scheme, see the Bench Press Pyramid Calculator.
- A best equation for each rep count. The studies above do not name one.
The original publications for Epley, Lander, Lombardi, Mayhew, O'Conner and Wathan, and the 1992 study behind the AIS ±10%, are cited through secondary sources. To turn reps and effort into a load, use the RPE Calculator or the RIR to RPE Calculator.
Frequently Asked Questions
Sources & References
- Strength testing: predicting a one-rep max from reps-to-fatigue. Brzycki M. Journal of Physical Education, Recreation & Dance 64(1):88-90 (1993)
- The accuracy of prediction equations for estimating 1-RM performance in the bench press, squat, and deadlift. LeSuer DA, McCormick JH, Mayhew JL, Wasserstein RL, Arnold MD. Journal of Strength and Conditioning Research 11(4):211-213 (1997)
- Prediction of one repetition maximum strength from multiple repetition maximum testing and anthropometry. Reynolds JM, Gordon TJ, Robergs RA. Journal of Strength and Conditioning Research 20(3):584-592 (2006)
- Accuracy of prediction equations for determining one repetition maximum bench press in women before and after resistance training. Mayhew JL, Johnson BD, LaMonte MJ, Lauber D, Kemmler W. Journal of Strength and Conditioning Research 22(5):1570-1577 (2008)
- Predicting maximal strength in trained postmenopausal woman. Kemmler WK, Lauber D, Wassermann A, Mayhew JL. Journal of Strength and Conditioning Research 20(4):838-842 (2006)
- Maximal Number of Repetitions at Percentages of the One Repetition Maximum: A Meta-Regression and Moderator Analysis of Sex, Age, Training Status, and Exercise. Nuzzo JL, Pinto MD, Nosaka K, Steele J. Sports Medicine 54(2):303-321 (bench press values as given in the paper's text) (2024)
- National Protocols for the Assessment of Strength and Power, Version 2.0 (effective July 2022). Australian Institute of Sport and the National Institute Network. Australian Sports Commission (2022)
- Application of the repetitions in reserve-based rating of perceived exertion scale for resistance training. Helms ER, Cronin J, Storey A, Zourdos MC. Strength and Conditioning Journal 38(4):42-49 (2016)

Certified Personal Trainer & Sports Nutritionist
NASM-certified fitness and nutrition coach with over 10 years of hands-on experience helping people build strength, lose fat, and live healthier lives. Specializing in gym-based workouts with a strong focus on lifting technique, biomechanics, and practical exercise science. Through FitLifeRegime, sharing the tools, tips, and insights that have worked for hundreds of clients — helping you start your own fitness journey with confidence and clarity.
Learn more about Manish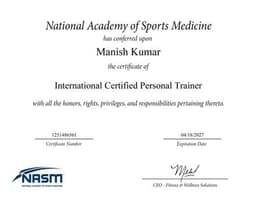
NASM Certified
Certified Personal Trainer & Sports Nutritionist from the National Academy of Sports Medicine
Disclaimer: This tool is for informational and personal journaling purposes only. Results are estimates based on published formulas and may vary based on individual factors such as genetics, training history, and measurement technique.