
Key Takeaways
- RPE is a rating of how hard something felt. In lifting it usually means a 1 to 10 scale tied to reps in reserve[2]. In cardio it usually means Borg's 6 to 20 scale[4]. This page handles both and never mixes them.
- For lifting, a published chart gives a share of your 1RM for each reps and RPE pair from 1 to 8 reps[1]. Almost all of that chart is estimated, not measured, and it comes from squat data. The result is a starting point, not a test.
- Rating your own effort is not exact. In a pooled analysis, lifters on average predicted about 1 fewer rep than they could do[3]. That moves the answer, so read the warnings under the result.
- For cardio, rating times 10 only approximates heart rate[5]. Across studies the correlation between the two averages 0.62[9], so many people sit well off that line.
- I left out the popular Tuchscherer chart and the heart rate reserve formulas because I could not trace them to a peer-reviewed source. The last section lists what is missing.
What RPE Is, and Which Scale You Mean
RPE stands for rating of perceived exertion. It is your own judgement of how hard an effort was, from the feeling of breathing, heart rate, sweat and muscle fatigue[5].
There is more than one scale, and a number from one is not the same as the same number on another. The table shows the three this page uses.
| Scale | Range and anchors | Used for |
|---|---|---|
| Reps-in-reserve RPE | 1 to 10. 10 is no reps left, 8 is about 2 left, 7 is about 3 left.[2] | A single set of a lift |
| Borg 6 to 20 | 6 is no exertion at all and 20 is maximal exertion. The unusual start at 6 comes from its link to heart rate.[5][7] | Continuous cardio effort |
| 0 to 10 | 0 is the effort of sitting and 10 is maximal effort. The CDC calls 5 to 6 moderate, with vigorous beginning at 7 or 8.[6] | General effort and intensity checks |
The scales are not interchangeable. This page does not convert between them, because I found no validated conversion.
For a whole week of training, multiplying a rating by minutes gives a session load. That is a different use of the 0 to 10 scale, covered by the RPE Load Calculator.
How to Rate a Set (Lifting)
The lifting scale asks one question: how many more reps could you have done with the same form? The answer maps to a number[1][2].
| RPE | Reps in reserve | What it means |
|---|---|---|
| 10 | 0 | Maximum effort |
| 9.5 | 0 | No further repetitions but could increase load |
| 9 | 1 | 1 repetition remaining |
| 8.5 | 1–2 | 1–2 repetitions remaining |
| 8 | 2 | 2 repetitions remaining |
| 7.5 | 2–3 | 2–3 repetitions remaining |
| 7 | 3 | 3 repetitions remaining |
| 5–6 | 4–6 | 4–6 repetitions remaining |
| 3–4 | n/a | Light effort |
| 1–2 | n/a | Little to no effort |
Wording of the reps-in-reserve RPE scale. The whole-number rows are Table 1 of Helms et al. (2016). The half-point rows follow the scale in Zourdos et al. (2016).
How to rate your set
- Finish the set with the form you would accept in a working set.
- Ask how many more reps you could have done. Zero is RPE 10. One is RPE 9. Two is RPE 8.
- If you had no reps left but could have added weight, use 9.5.
- Enter the weight, the reps you did and that RPE in the calculator.
Your guess runs low, on average
A scoping review with an exploratory meta-analysis found that lifters on average predicted 0.95 fewer reps than they could do (95% CI 0.17 to 1.73), with large differences between studies[3].
If you tend to call a set RPE 9 when you had two reps left, the estimated 1RM will read low. A heavier, lower-rep set leaves less room for that error.
Experience matters too. In the squat study behind the scale, 15 experienced squatters rated a true max single 9.80 on average and 14 novices rated it 8.96[1][2]. Helms and colleagues advise novices to practise rating sets before they base training on the scale[1].
The RPE Chart: Percent of 1RM by Reps and RPE
Helms and colleagues published a table of the share of 1RM for each reps and RPE pair[1]. The calculator reads that table, so you get the same numbers from the chart below and from the tool.
| Reps | RPE 10 | RPE 9.5 | RPE 9 | RPE 8.5 | RPE 8 | RPE 7.5 | RPE 7 |
|---|---|---|---|---|---|---|---|
| 1 | 100% | 97% | 95% | 93% | 91% | 89% | 87% |
| 2 | 95% | 93% | 91% | 89% | 87% | 86% | 85% |
| 3 | 91% | 89% | 87% | 86% | 85% | 84% | 83% |
| 4 | 87% | 86% | 85% | 84% | 83% | 82% | 81% |
| 5 | 85% | 84% | 83% | 82% | 81% | 80% | 79% |
| 6 | 83% | 82% | 81% | 80% | 79% | 77.5% | 76% |
| 7 | 81% | 80% | 79% | 77.5% | 76% | 74.5% | 73% |
| 8 | 79% | 77.5% | 76% | 74.5% | 73% | 71.5% | 70% |
% of 1RM, Table 2 of Helms et al. (2016). Only the three bold values are measured. The rest are estimates.
To get your 1RM from a set, the calculator divides the weight by the chart share. Then it multiplies that 1RM by the share for any other reps and RPE to give the next load.
If you already know your 1RM, switch to From my 1RM. It skips the first step and fills the load table straight from the chart, with your next set highlighted.
Worked example: 100 kg for 5 reps at RPE 8
Chart share for 5 reps at RPE 8 = 81%
Estimated 1RM = 100 ÷ (81 ÷ 100) = 123.5 kg
Chart share for 3 reps at RPE 9 = 87%
Load for 3 reps at RPE 9 = 123.5 × 87 ÷ 100 = 107.4 kg
- It is mostly estimated. The chart is based on mean scores of experienced squatters. Only 3 of the 56 cells were measured, which are single reps at 90 and 100% of 1RM and 8 reps at 70%[1].
- Individuals vary. At 8 reps and 70% of 1RM, the scores had a standard deviation of 1.2. That means roughly two-thirds of lifters might report 2 to 4 reps in reserve, and Helms and colleagues say the chart should not be used as an absolute conversion tool[1].
- It may not fit other lifts. The authors note it may differ for machines, single-joint exercises and upper-body lifts[1]. The calculator shows that warning every time.
- It stops at 8 reps and RPE 7. I do not extend it, because I have no source for the values outside the table.
Check It Against Rep-Max Equations
When a set went to failure (RPE 10) and you did 2 or more reps, the calculator also runs the seven 1RM equations that LeSuer and colleagues compared[13]. They predict a 1RM from reps to fatigue, based on sets of 10 reps or fewer, so they only apply at RPE 10.
For 100 kg for 5 reps at RPE 10, the chart gives 117.6 kg and the equations give 112.5 to 119 kg. That spread shows how much the choice of method matters. For a deeper look at each equation, see the 3 Rep Max Calculator.
None of the seven is a gold standard. In LeSuer's test of 67 untrained college students, the average error was significant for most equations on the bench press and squat, and every equation underestimated the deadlift[13].
How Accurate Is RPE?
Here is what each source looked at, so you can judge how far to trust a number:
| Source | What it found | Limit |
|---|---|---|
| Helms et al., 2016[1] | Published the % of 1RM chart for reps 1 to 8 and RPE 7 to 10 and explains how to use the scale. | Mostly estimated, based on squats. |
| Halperin et al., 2022[3] | Lifters on average predicted 0.95 fewer reps than they could do (95% CI 0.17 to 1.73). | Large differences between studies. It is about predicted reps, not this chart. |
| Chen et al., 2002[9] | Meta-analysis in healthy people. Weighted mean correlation of RPE with heart rate was 0.62, and with blood lactate 0.57. The authors say validity may not be as high as the 0.80 to 0.90 once thought. | Published in 2002, so it predates later work. Correlation is not agreement. |
| Scherr et al., 2013[10] | 2,560 Caucasian men and women (median age 28) on incremental treadmill or cycle tests. RPE correlated with heart rate at r = 0.74 and with lactate at r = 0.83. Sex, age and activity level did not change that association significantly. | A young sample (the middle half were aged 17 to 44). Grummt's later study found ratings 1 to 2 points higher at the higher lactate levels, and that age and sex mattered at lower intensities. |
| Grummt et al., 2024[11] | 6,311 people tested at a sports medicine outpatient clinic. Proposed RPE 11 or less as light, 12 to 14 moderate, 15 to 17 vigorous. RPE at the same lactate level varied with age, sex, ergometer type, fitness and test length, mostly at lower intensities. | Retrospective, from a sports medicine clinic, so more active than average. |
| Mitchell et al., 2019[12] | 16 healthy adults (average age 25), 100 mg metoprolol vs placebo. Heart rate was lower on the drug. The authors concluded the rating for a given relative intensity stayed unchanged, although ratings rose faster relative to heart rate. | Small, young and healthy, one drug and one dose. |
Cardio: the Borg 6 to 20 Scale and Heart Rate
Borg described perceptual effort ratings as important complements to behavioral and physiological measures of work capacity[4]. Williams prints these anchors for the 6 to 20 scale[7]:
| Rating | Anchor | Rating × 10 |
|---|---|---|
| 6 | No exertion at all | 60 bpm |
| 9 | Very light | 90 bpm |
| 11 | Light | 110 bpm |
| 13 | Somewhat hard | 130 bpm |
| 15 | Hard (heavy) | 150 bpm |
| 17 | Very hard | 170 bpm |
| 19 | Extremely hard | 190 bpm |
| 20 | Maximal exertion | 200 bpm |
Only these numbers carry a word here. Sources place 'extremely light' at 7 or at 7.5, so I left it out and describe 7 and 8 by the anchors either side.
An archived CDC page says a rating times 10 gives a rough heart rate, so 12 means about 120 bpm, and calls it only an approximation that varies with age and physical condition[5]. Williams describes the same link for healthy adults, with 6 matching 60 bpm and 8 matching 80 bpm[7].
Intensity bands
The same CDC page says practitioners generally agree that ratings of 12 to 14 mean moderate intensity[5]. Grummt and colleagues propose 11 or less for light, 12 to 14 for moderate and 15 to 17 for vigorous, based on lactate thresholds[11]. The calculator uses their bands and shows the source with each result.
Percent of maximum heart rate
If you enter your age, the page predicts a maximum heart rate with the Tanaka equation from a meta-analysis of 351 studies, confirmed in 514 healthy adults aged 18 to 81[8]. That is why the age box stops at 81.
The equation did not differ by sex or habitual activity, but real maximums scatter around it with a standard deviation of about 10 bpm.
Worked example: rating 13, age 40
Predicted maximum = 208 − 0.7 × 40 = 180 bpm
Rough heart rate = 13 × 10 = 130 bpm
Share of predicted maximum = 130 ÷ 180 = 72.2%
Tanaka and colleagues also note that the older 220 − age rule crosses their equation at age 40 and differs by about 10 bpm at 70. With that scatter, the real maximum of some older adults could be more than 20 bpm above the old rule[8].
Their volunteers were healthy, did not smoke and took no medication other than hormone replacement, so the equation may fit others less well.
If you take heart-rate-lowering medication
Do not use rating times 10. The CDC names the Borg scale as the preferred way to judge intensity when medication affects heart rate[5].
In a small trial, a beta blocker lowered heart rate at the ventilatory threshold and at maximal effort, while the authors concluded the rating for a given relative intensity stayed unchanged[12]. Because heart rate shifted and the rating did not, the calculator hides the heart rate estimate when you tick the box.
Using the Result
- For lifting, start from a heavy set taken close to failure. In the pooled data, predictions were more accurate closer to failure and with heavier loads[3].
- If you are new to RPE, check your rating first. Helms and colleagues suggest taking a set short of failure, recording a score, then repeating the same load to failure to see how close you were[1].
- Use the 1RM as a starting point for the next session. A rested, warmed-up set with a spotter or safety bars tells you more than any chart.
- To turn reps in reserve straight into an RPE, use the RIR to RPE Calculator.
- For cardio, treat the band as a rough guide and let how you feel, and your own heart rate if you track it, make the call.
- For a running or cycling session, the Running RPE Calculator and the Cycling RPE Calculator turn a 0 to 10 rating and minutes into a session load.
What This Page Leaves Out, and Why
Where I could not trace a table, formula or claim to a primary source I could check, I left it out. Here is what is missing:
- The Tuchscherer (RTS) RPE chart. Many calculators use it. It comes from a training manual, not a peer-reviewed study, and Reactive Training Systems says lifters should customize it[14]. A printed copy of the chart shows 86.3% for 5 reps at RPE 10[15], against 85% in the Helms chart, so another calculator may not match this one.
- Heart rate reserve formulas that map RPE to a heart rate. I found calculators that print them, but no study that validates them.
- Separate maximum heart rate formulas for men and women. Tanaka found no difference by sex[8], so the page uses one equation.
- Recommended durations by RPE and any claim about training results from RPE-guided exercise. I did not find a primary source for either.
- A conversion between the 6 to 20 and 0 to 10 scales. They are different scales, and I found no validated conversion.
- RPE values above 8 reps in lifting. The chart stops at 8 reps, and I do not extrapolate.
Frequently Asked Questions
Sources & References
- Application of the repetitions in reserve-based rating of perceived exertion scale for resistance training. Helms ER, Cronin J, Storey A, Zourdos MC. Strength and Conditioning Journal 38(4):42-49 (2016)
- Novel resistance training-specific rating of perceived exertion scale measuring repetitions in reserve. Zourdos MC, Klemp A, Dolan C, Quiles JM, Schau KA, Jo E, Helms E, Esgro B, Duncan S, Garcia Merino S, Blanco R. Journal of Strength and Conditioning Research 30(1):267-275 (2016)
- Accuracy in predicting repetitions to task failure in resistance exercise: a scoping review and exploratory meta-analysis. Halperin I, Malleron T, Har-Nir I, Androulakis-Korakakis P, Wolf M, Fisher J, Steele J. Sports Medicine 52(2):377-390 (2022)
- Psychophysical bases of perceived exertion. Borg GA. Medicine & Science in Sports & Exercise 14(5):377-381 (1982)
- Perceived Exertion (Borg Rating of Perceived Exertion Scale), last reviewed June 3, 2022 (the original address now redirects to a different CDC page, so the link is an archived copy). Centers for Disease Control and Prevention (2022)
- How to Measure Physical Activity Intensity (page dated Dec. 4, 2025). Centers for Disease Control and Prevention (2025)
- The Borg Rating of Perceived Exertion (RPE) scale. Williams N. Occupational Medicine 67(5):404-405 (2017)
- Age-predicted maximal heart rate revisited. Tanaka H, Monahan KD, Seals DR. Journal of the American College of Cardiology 37(1):153-156 (2001)
- Criterion-related validity of the Borg ratings of perceived exertion scale in healthy individuals: a meta-analysis. Chen MJ, Fan X, Moe ST. Journal of Sports Sciences 20(11):873-899 (2002)
- Associations between Borg's rating of perceived exertion and physiological measures of exercise intensity. Scherr J, Wolfarth B, Christle JW, Pressler A, Wagenpfeil S, Halle M. European Journal of Applied Physiology 113(1):147-155 (2013)
- Rating of perceived exertion: a large cross-sectional study defining intensity levels for individual physical activity recommendations. Grummt M, Hafermann L, Claussen L, Herrmann C, Wolfarth B. Sports Medicine - Open 10:71 (2024)
- Physiological and perceived exertion responses during exercise: effect of β-blockade. Mitchell BL, Davison K, Parfitt G, Spedding SJ, Eston RG. Medicine & Science in Sports & Exercise 51(4):782-791 (2019)
- The accuracy of prediction equations for estimating 1-RM performance in the bench press, squat, and deadlift. LeSuer DA, McCormick JH, Mayhew JL, Wasserstein RL, Arnold MD. Journal of Strength and Conditioning Research 11(4):211-213 (1997)
- Customizing Your RPE Chart (blog post that says the chart is described in The Reactive Training Manual and is best customized to the athlete). Reactive Training Systems
- The Tuchscherer RPE Chart Explained (a third-party printed copy of the chart's values, not the original source). Fitness Volt

Certified Personal Trainer & Sports Nutritionist
NASM-certified fitness and nutrition coach with over 10 years of hands-on experience helping people build strength, lose fat, and live healthier lives. Specializing in gym-based workouts with a strong focus on lifting technique, biomechanics, and practical exercise science. Through FitLifeRegime, sharing the tools, tips, and insights that have worked for hundreds of clients — helping you start your own fitness journey with confidence and clarity.
Learn more about Manish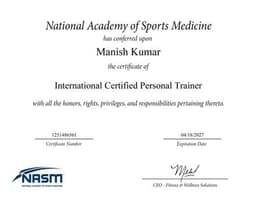
NASM Certified
Certified Personal Trainer & Sports Nutritionist from the National Academy of Sports Medicine
Disclaimer: This tool is for informational and personal journaling purposes only. Results are estimates based on published formulas and may vary based on individual factors such as genetics, training history, and measurement technique.