
Key Takeaways
- Enter the weight and reps (1 to 10) from a strict, standing press taken to failure. Seven published equations turn that into a 1RM[1], and the page shows the average with the lowest and highest.
- The equations were not built on the press. LeSuer tested the bench press, squat and deadlift[1], and the only press study I found is a small conference abstract[2].
- In that abstract, sets taken to failure at 70% of 1RM gave low estimates and sets at 90% gave high ones[2]. For 50 kg for 5 reps the seven equations give 56.3 to 59.5 kg.
- Treat the result as a starting load. The Australian Institute of Sport testing manual quotes about ±10% variability and says not to use predictions to record a 1RM[6].
What Counts as an Overhead Press 1RM
Your overhead press (OHP) 1RM is the heaviest weight you can press from your shoulders to lockout for one rep with form you would accept. If you can press it twice, it was below your max.
Overhead press, shoulder press, military press and strict press are used loosely. Kroell and Mike describe the standing barbell overhead press as a vertical-trunk press with the feet parallel at about shoulder width, and note that USA Weightlifting and the NSCA define the "military press" with conflicting foot positions[7].
This page means a standing barbell press with no leg drive. Use the same press every time you compare results.
For dumbbells, enter the weight in one hand and read the answer as per hand, because the equations scale with weight. I found no accuracy data for dumbbell, seated or machine presses, so those results are rougher still.
How the Estimate Works
Each equation turns the reps you did into a multiplier, and your 1RM is your weight times that multiplier. LeSuer and colleagues print all seven in their Table 1[1].
What happens when you press Calculate
- Each of the seven equations turns your reps into a multiplier.
- Your weight times each multiplier gives seven 1RM estimates.
- The page shows the lowest, the highest and the plain average of the seven.
- For 1 to 8 reps it also reads your set on the Helms RPE chart as a second opinion[4].
The seven are Epley, Brzycki, Lander, Lombardi, Mayhew et al., O'Conner et al. and Wathan. I checked Brzycki's equation against his own paper[3], but I only saw the other six as LeSuer printed them.
Worked example: 50 kg for 5 reps to failure
Epley: 50 × (1 + 0.0333 × 5) = 58.3 kg
Brzycki: 50 × 100 ÷ (102.78 − 2.78 × 5) = 56.3 kg
Lombardi: 50 × 5^0.1 = 58.7 kg
The average is there because most people want one number. I haven't seen a study that tests the average, so treat the range as the real answer. Each equation's form and its source are listed on the One Rep Max Calculator page.
How Accurate Is It for the Press?
LeSuer's study covered the bench press, squat and deadlift in untrained college students[1]. It did not include the press, so nothing in it tells you how the equations behave overhead.
The only press study I found is a conference abstract by Varner and colleagues[2]. Thirty resistance-trained people (23 ± 3 years) did a 1RM test for the press and the deadlift.
They then came back twice and did one set of each lift to fatigue, at 70% of 1RM on one visit and 90% on the other, in random order.
- At 70% of 1RM, three of the seven equations read significantly low, by 3.1, 5.7 and 6.2 kg.
- At 90% of 1RM, four equations read significantly high, by 3.0, 3.2, 3.5 and 4.7 kg.
- The authors' explanation is that the press and deadlift start with the lifting phase, unlike the squat and bench press, which may change how the equations behave.
It is an abstract, and I couldn't open the full text. So I don't know which press they used, which equations missed in each direction, or how the in-between rep counts behave.
- Which set to use. The abstract suggests a lighter set (70% of 1RM) reads low and a heavier one (90%) can read high. I can't tell you a best rep count for the press, so the page accepts 1 to 10 and shows the spread.
- Keep reps strict. More reps at the same weight always gives a higher estimate in all seven equations, so a rep that gets help from your legs inflates the number.
- Go to failure, or use RPE. The equations were built from reps to fatigue, so a set that stopped short reads low. A review of 12 studies found lifters under-predicted their reps left by about 1 rep on average, so failure is easy to misjudge[9].
- Allow for about 10%. The AIS manual says estimating a maximum from submaximal reps carries large variability (±10%) that depends on the exercise and the lifter[6]. It takes the figure from a 1992 study I haven't read.
Overhead Press 1RM Chart by Weight and Reps
Find the weight you pressed and the reps you did to failure. The figure is the average of the seven equations, so the true range around it is wider.
| Weight lifted (kg) | 3 reps | 5 reps | 8 reps |
|---|---|---|---|
| 20 | 21.9 | 23.1 | 24.9 |
| 30 | 32.8 | 34.6 | 37.4 |
| 40 | 43.7 | 46.2 | 49.9 |
| 50 | 54.7 | 57.7 | 62.4 |
| 60 | 65.6 | 69.3 | 74.8 |
| 70 | 76.5 | 80.8 | 87.3 |
| 80 | 87.4 | 92.4 | 99.8 |
Average 1RM from the seven equations, in kg, for a press taken to failure. The same equations apply to every lift, so this is not a press-specific model.
Once you have a 1RM, the calculator builds a table of loads at 50 to 100% of it. It also shows loads for 1 to 8 reps at RPE 10, 9 and 8 from the Helms chart[4].
That chart came from experienced squatters in one study[5], and only three cells are measured sets. For the press it is a rough guide, and I found no press-specific table of reps at a given percentage.
Push Press, Seated and Dumbbell Presses
The push press is a different lift, so don't enter push press reps here. In one study of 15 men and 15 women (average weightlifting experience 2.6 and 2.2 years), the push press 1RM averaged 1.0 ± 0.1 times bodyweight for men and 0.8 ± 0.1 for women[8].
That study did not test the strict press, so it gives no conversion between the two. I left out percentages that claim to convert one into the other because I found no source for them.
For seated, dumbbell and machine presses, I found no study on how well these equations predict the 1RM. Use the result as a loose guide and compare it only with the same exercise.
If You Test a Real Press 1RM
The Australian Institute of Sport testing manual (version 2.0, effective July 2022) has protocols for other lifts, and I found none for the overhead press[6]. Its bench press warm-up table is on the One Rep Max Calculator page.
The closest press protocol I read is from the push press study. Lifters started at 95% of their self-estimated 1RM, added 2.5 to 5% after each successful attempt, and rested 3 to 5 minutes between attempts[8].
That was for weightlifting presses, not the strict press, so use it as an example and not as a prescription.
What About Overhead Press Standards?
I haven't built a standards table. Three app datasets that publish overhead press standards disagree with each other, so I show the gap instead of picking one.
| Dataset | Man at 180 lb | Woman at 140 lb | What intermediate means |
|---|---|---|---|
| Strength Level[10] | 140 | 70 | Stronger than 50% of its lifters |
| Gravitus[11] | 125 | about 60 | 50th percentile of its logged lifters |
| StrengthLog[12] | 120 | 64 | Stronger than 50% of its users |
Intermediate standard for the overhead press, in lb, from three app datasets. Strength Level lists the lift as Shoulder Press. Checked November 2026.
These are training-app logs, not peer-reviewed studies. Each defines its own levels, and each only includes people who log their lifts.
If you add your bodyweight under More options, the calculator divides your 1RM by it. That is plain division and does not rate your strength.
What This Page Leaves Out
I left these out because I couldn't trace them to a source I could open:
- Press variations as a percentage of your strict press. Seated, push press, dumbbell and behind-the-neck figures.
- Fixed strength standards by bodyweight, and ratios of your press to your bench, squat or deadlift.
- A "best" equation for the press. The studies above don't name one.
- Programming, periodisation, mobility and injury advice. None tied to a source I could open. For training loads from a 1RM, see the RPE Calculator.
Still unverified: the original publications for Epley, Lander, Lombardi, Mayhew, O'Conner and Wathan, the full text of the Varner abstract, and the 1992 study behind the AIS ±10%.
Frequently Asked Questions
Sources & References
- The accuracy of prediction equations for estimating 1-RM performance in the bench press, squat, and deadlift. LeSuer DA, McCormick JH, Mayhew JL, Wasserstein RL, Arnold MD. Journal of Strength and Conditioning Research 11(4):211-213 (1997)
- The accuracy of prediction equations for estimating 1RM in the press and the deadlift. Varner W, Boring J, Beck LL, Beck M, Fahs CA. Medicine & Science in Sports & Exercise 52(7S):46-47 (conference abstract). Abstract only; full text not opened (2020)
- Strength testing: predicting a one-rep max from reps-to-fatigue. Brzycki M. Journal of Physical Education, Recreation & Dance 64(1):88-90 (1993)
- Application of the repetitions in reserve-based rating of perceived exertion scale for resistance training. Helms ER, Cronin J, Storey A, Zourdos MC. Strength and Conditioning Journal 38(4):42-49 (2016)
- Novel resistance training-specific rating of perceived exertion scale measuring repetitions in reserve. Zourdos MC, Klemp A, Dolan C, Quiles JM, Schau KA, Jo E, Helms E, Esgro B, Duncan S, Garcia Merino S, Blanco R. Journal of Strength and Conditioning Research 30(1):267-275 (2016)
- National Protocols for the Assessment of Strength and Power, Version 2.0 (effective July 2022). Australian Institute of Sport and the National Institute Network. Australian Sports Commission (2022)
- Does sex impact the differences and relationships in the one repetition maximum performance across weightlifting overhead pressing exercises?. Soriano MA, García-Ramos A, Calderbank JA, Marín PJ, Sáinz de Baranda P, Comfort P. Journal of Strength and Conditioning Research 36(7):1930-1935 (published online July 2020) (2022)
- Exploring the standing barbell overhead press. Kroell J, Mike J. Strength and Conditioning Journal 39(6):70-75 (2017)
- Accuracy in predicting repetitions to task failure in resistance exercise: a scoping review and exploratory meta-analysis. Halperin I, Malleron T, Har-Nir I, Androulakis-Korakakis P, Wolf M, Fisher J, Steele J. Sports Medicine 52(2):377-390 (2022)
- Shoulder Press Standards for Men and Women (lb). Training-app data, not peer reviewed; checked November 2026. Strength Level. strengthlevel.com (2026)
- Overhead Press Standards: How Strong Is Your OHP? Training-app data, not peer reviewed; checked November 2026. Gravitus. gravitus.com (2026)
- Overhead Press Strength Standards for Men and Women (lb). Training-app data, not peer reviewed; checked November 2026. StrengthLog. strengthlog.com (2026)

Certified Personal Trainer & Sports Nutritionist
NASM-certified fitness and nutrition coach with over 10 years of hands-on experience helping people build strength, lose fat, and live healthier lives. Specializing in gym-based workouts with a strong focus on lifting technique, biomechanics, and practical exercise science. Through FitLifeRegime, sharing the tools, tips, and insights that have worked for hundreds of clients — helping you start your own fitness journey with confidence and clarity.
Learn more about Manish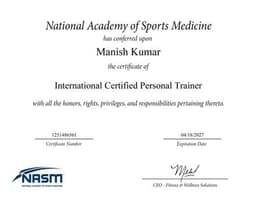
NASM Certified
Certified Personal Trainer & Sports Nutritionist from the National Academy of Sports Medicine
Disclaimer: This tool is for informational and personal journaling purposes only. Results are estimates based on published formulas and may vary based on individual factors such as genetics, training history, and measurement technique.