
Key Takeaways
- A squat pyramid changes the weight every set and moves the reps the other way. It can go up, down, or up and back down[1].
- Reviews and trials I found show strength and size gains with a pyramid, but not more than with straight sets[2][3][5]. Choose it because you like the structure.
- Pick reps and effort, and the weights come from a chart built on back squat ratings. Or pick your own percentages and I check the reps against averages from a large meta-regression[6][7].
- Both tables are averages. Real lifters land a few reps either side of them.
How a Squat Pyramid Works
The three shapes, and what a rung is.
A pyramid is a run of sets where the weight rises or falls and the reps move the other way. Heavy sets get few reps, light sets get more[1].
- Ascending. Light to heavy. Your heaviest set comes last.
- Descending. Heavy to light. Your heaviest set comes first.
- Triangle. Up to the heaviest rung once, then back down through the lighter ones.
The calculator calls each step of the ladder a rung. A triangle plays every rung below the top twice, so it holds more reps than the same rungs done once.
Worked squat pyramid
Does a Pyramid Beat Straight Sets?
Short answer: not in the studies I found.
A 2023 review of 15 studies found pyramid training was not better than traditional training for strength gains, muscle growth or acute physiological responses[2]. Its authors say the choice can come down to periodization, motivation or personal preference.
The review notes its studies used 8 to 12 reps and/or 67 to 85% of 1RM[2]. So it may not tell you much about very heavy, low-rep pyramids.
| Study | Who | What it found |
|---|---|---|
| Angleri 2017[5] | 32 well-trained men, legs randomised to each method, 12 weeks, leg press and leg extension | Muscle size rose 7.6% (straight sets) and 7.5% (crescent pyramid), with similar strength gains |
| Ribeiro 2017[3] | 25 older women, crossover, 8 weeks per phase | Chest press 1RM rose 12.4% with straight sets and 11.5% with a 12/10/8 pyramid. Knee extension rose 12.5% and 11.8%. No differences between groups |
| Ribeiro 2018[4] | 33 trained older women, randomised, 8 weeks | Both groups gained chest press strength and muscle, and the pyramid was not better |
Trials that compared a pyramid with straight sets
I read the abstracts, not the full papers. They report chest press, knee extension, leg press and leg extension results, and none names a barbell squat.
The 2026 ACSM position stand pooled 137 systematic reviews. It found strength was enhanced by loads of 80% of 1RM or more, done for 2 to 3 sets[8].
It also lists "set structure" among variables that did not consistently change outcomes[8]. The abstract does not name pyramids, so I would not read that as a verdict on them.
Where the Weights Come From
Where each number on the page comes from.
Reps and effort. The calculator reads a cell from Table 2 of Helms and colleagues. It gives the percentage of 1RM for 1 to 8 reps at RPE 7 to 10[6]. RPE is on the Zourdos scale, where RPE 8 means about 2 reps left[9].
The chart comes from mean ratings by experienced lifters doing the barbell back squat, so the lift matches. Only three combinations were measured (1 rep at 90% and at 100%, and 8 reps at 70%), and the rest are estimates[6]. The authors say it should not be treated as absolute.
Your own percentage. I compare the reps you plan with Nuzzo and colleagues, a meta-regression of 269 studies on how many reps people do to failure at each percentage of 1RM[7]. I use the table from its main model.
The authors made separate tables for the bench press and the leg press, and say the main table suits other exercises, squat included. Squat was only 52 of the 452 groups (12%), and barbell and Smith machine squats were pooled. They say more data are needed for exercise-specific tables[7].
| % of 1RM | Average reps | 95% CI of the average | SD between people |
|---|---|---|---|
| 95 | 3.28 | 2.66 to 4.04 | 1.66 |
| 90 | 4.94 | 4.35 to 5.61 | 1.90 |
| 85 | 7.15 | 6.69 to 7.65 | 2.19 |
| 80 | 9.75 | 9.32 to 10.20 | 2.51 |
| 75 | 12.37 | 11.87 to 12.88 | 2.88 |
| 70 | 14.80 | 14.23 to 15.40 | 3.31 |
| 65 | 17.11 | 16.36 to 17.90 | 3.80 |
| 60 | 19.53 | 18.52 to 20.59 | 4.37 |
| 55 | 22.43 | 21.22 to 23.71 | 5.02 |
| 50 | 25.99 | 24.54 to 27.53 | 5.76 |
| 45 | 30.37 | 28.22 to 32.68 | 6.61 |
| 40 | 35.75 | 31.97 to 39.98 | 7.60 |
| 35 | 42.37 | 35.62 to 50.39 | 8.72 |
| 30 | 50.50 | 39.13 to 65.16 | 10.02 |
Average reps to failure by % of 1RM (Nuzzo et al. 2024, main model)
I typed these values from the paper's published figure and checked them against the numbers in its text. Between two rows the check does not guess. It only uses the fact that reps to failure fall as the percentage rises.
Averages are not you
Squat and bench reps are not interchangeable. In a study of 8 trained and 8 untrained men, more reps were done in the back squat than in the bench press or arm curl at 60% of 1RM, and the differences were much smaller at 80 and 90%[10].
That is why I do not use the bench figures for squats. A "past average" flag on a squat set is a prompt to look, not a ban.
Squat Pyramid Chart by Reps and Effort
Percent of 1RM from the Helms chart.
Hold the effort the same and the percentage rises as the reps fall. That is a pyramid where every set feels equally hard. Use the RPE calculator if you want the same chart turned into a 1RM.
| Reps | RPE 7 | RPE 8 | RPE 9 | RPE 10 |
|---|---|---|---|---|
| 1 | 87% | 91% | 95% | 100% |
| 2 | 85% | 87% | 91% | 95% |
| 3 | 83% | 85% | 87% | 91% |
| 4 | 81% | 83% | 85% | 87% |
| 5 | 79% | 81% | 83% | 85% |
| 6 | 76% | 79% | 81% | 83% |
| 7 | 73% | 76% | 79% | 81% |
| 8 | 70% | 73% | 76% | 79% |
Percent of 1RM by reps and RPE, from Table 2 of Helms et al. 2016
Pick a row for each rung, then use the calculator above to turn it into weights for your max. The Print button on the results saves a copy for the gym.
Getting Your Max Right
Every load moves with this one number.
A tested single is the cleanest input. If you have not tested, the calculator can estimate a max from a set taken to failure, using the same seven equations as the 1RM calculator.
In a study of 67 untrained college students, six of the seven equations read low for the squat, by roughly 3 to 8%[11]. The equations were built on sets of about 10 reps or fewer, so a lower-rep set is a better input. The 5RM calculator is one way to get a heavier set.
To total the session's work, try the workout volume calculator, and see the rest time calculator for rests. If you also pull heavy, the squat to deadlift ratio calculator compares your two lifts, and the bench press pyramid calculator does the same job for the bench.
What Changed From the Earlier Version
What I dropped from the earlier page, and why.
I read the earlier page's script. It spaced percentages evenly between a minimum and maximum, and reps evenly across a goal's range, with no link between the two.
For example, its endurance goal gave the heaviest set 12 reps. Now reps and weight come from the same chart, or from a check against published averages.
I removed claims I could not source:
- That pyramids reduce injury risk or give superior gains.
- Slow-twitch and fast-twitch percentage zones.
- A rule to always use safety bars at 80% and above.
- A required number of years of experience for a descending pyramid.
The diamond shape, the goal and experience selectors, the session-time estimate, the rest and zone table and the printed fatigue index formula went too.
The earlier page listed no references and had no FAQ. This one cites each table and review it uses.
Limits and What Is Left Out
Where this page stops.
- The effort chart covers 1 to 8 reps. I did not extend it, because I have no source for values beyond it.
- The chart comes from the barbell back squat. I have no data for front, box or other squat variations, so I would not apply it to them.
- The rep check is not a squat-only table, and between two rows it has no value of its own. It cannot tell you whether a set at 77% or 87% is right for you.
- I found no source for a standard warm-up or rest protocol for a pyramid, so the page prescribes neither.
- I read abstracts for the pyramid trials, the ACSM stand and the squat-versus-bench study, not full papers. None of the pyramid abstracts names a barbell squat.
- I did not find data on how fatigue from earlier sets changes these numbers, so later sets may not match the tables.
- The rep data came mostly from healthy people under 59, and 66% of the groups were male[7]. The authors found sex, age and training status did not clearly change the numbers, but I found nothing on height or body fat.
- Weights are a starting point. Set the safeties in a rack or use spotters, and stop a set if your form breaks down.
Frequently Asked Questions
Sources & References
- Pyramidal Systems in Resistance Training. Cattan GH. Encyclopedia 1(2):423-432 (narrative review) (2021)
- Pyramidal resistance training: A brief review of acute responses and long-term adaptations. Cardozo DC, Destro DS. Journal of Bodywork and Movement Therapies 35:21-27 (2023)
- Effects of Traditional and Pyramidal Resistance Training Systems on Muscular Strength, Muscle Mass, and Hormonal Responses in Older Women: A Randomized Crossover Trial. Ribeiro AS, Schoenfeld BJ, Fleck SJ, Pina FLC, Nascimento MA, Cyrino ES. Journal of Strength and Conditioning Research 31(7):1888-1896 (abstract) (2017)
- Effects of Different Resistance Training Systems on Muscular Strength and Hypertrophy in Resistance-Trained Older Women. Ribeiro AS, Aguiar AF, Schoenfeld BJ, Nunes JP, Cavalcanti EF, Cadore EL, Cyrino ES. Journal of Strength and Conditioning Research 32(2):545-553 (abstract) (2018)
- Crescent pyramid and drop-set systems do not promote greater strength gains, muscle hypertrophy, and changes on muscle architecture compared with traditional resistance training in well-trained men. Angleri V, Ugrinowitsch C, Libardi CA. European Journal of Applied Physiology 117(2):359-369 (abstract) (2017)
- Application of the repetitions in reserve-based rating of perceived exertion scale for resistance training. Helms ER, Cronin J, Storey A, Zourdos MC. Strength and Conditioning Journal 38(4):42-49 (2016)
- Maximal Number of Repetitions at Percentages of the One Repetition Maximum: A Meta-Regression and Moderator Analysis of Sex, Age, Training Status, and Exercise. Nuzzo JL, Pinto MD, Nosaka K, Steele J. Sports Medicine 54(2):303-321 (main model values read from Figure 2) (2024)
- American College of Sports Medicine Position Stand. Resistance Training Prescription for Muscle Function, Hypertrophy, and Physical Performance in Healthy Adults: An Overview of Reviews. Currier BS et al.. Medicine & Science in Sports & Exercise 58(4):851-872 (2026)
- Novel resistance training-specific rating of perceived exertion scale measuring repetitions in reserve. Zourdos MC, Klemp A, Dolan C, Quiles JM, Schau KA, Jo E, Helms E, Esgro B, Duncan S, Garcia Merino S, Blanco R. Journal of Strength and Conditioning Research 30(1):267-275 (2016)
- Relationship between the number of repetitions and selected percentages of one repetition maximum in free weight exercises in trained and untrained men. Shimano T, Kraemer WJ, Spiering BA, Volek JS, Hatfield DL, Silvestre R, Vingren JL, Fragala MS, Maresh CM, Fleck SJ, Newton RU, Spreuwenberg LP, Häkkinen K. Journal of Strength and Conditioning Research 20(4):819-823 (abstract) (2006)
- The accuracy of prediction equations for estimating 1-RM performance in the bench press, squat, and deadlift. LeSuer DA, McCormick JH, Mayhew JL, Wasserstein RL, Arnold MD. Journal of Strength and Conditioning Research 11(4):211-213 (1997)

Certified Personal Trainer & Sports Nutritionist
NASM-certified fitness and nutrition coach with over 10 years of hands-on experience helping people build strength, lose fat, and live healthier lives. Specializing in gym-based workouts with a strong focus on lifting technique, biomechanics, and practical exercise science. Through FitLifeRegime, sharing the tools, tips, and insights that have worked for hundreds of clients — helping you start your own fitness journey with confidence and clarity.
Learn more about Manish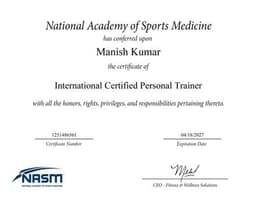
NASM Certified
Certified Personal Trainer & Sports Nutritionist from the National Academy of Sports Medicine
Disclaimer: This calculator is for informational and personal journaling purposes only. It logs measurements and compares them to published reference values. It is not health, medical, or nutrition advice.