BMI Calculator
Calculate your Body Mass Index with age-adjusted analysis and personalized health insights
What is BMI (Body Mass Index)?
BMI stands for Body Mass Index, a widely used screening tool that measures body fat based on your weight and height. Developed by Belgian mathematician Adolphe Quetelet in the 1830s, BMI provides a simple numeric measure to classify individuals into weight categories.
The BMI calculation divides a person’s weight in kilograms by the square of their height in meters. This resulting number helps identify potential health risks associated with being underweight, overweight, or obese.
According to the Centers for Disease Control (CDC), BMI is an effective screening tool for identifying weight-related health risks. However, it’s important to note that BMI doesn’t directly measure body fat percentage or account for muscle mass, bone density, or overall body composition.
For a complete health assessment, BMI should be combined with other measurements like waist circumference, waist-to-hip ratio, and body fat percentage for more accurate health evaluation.
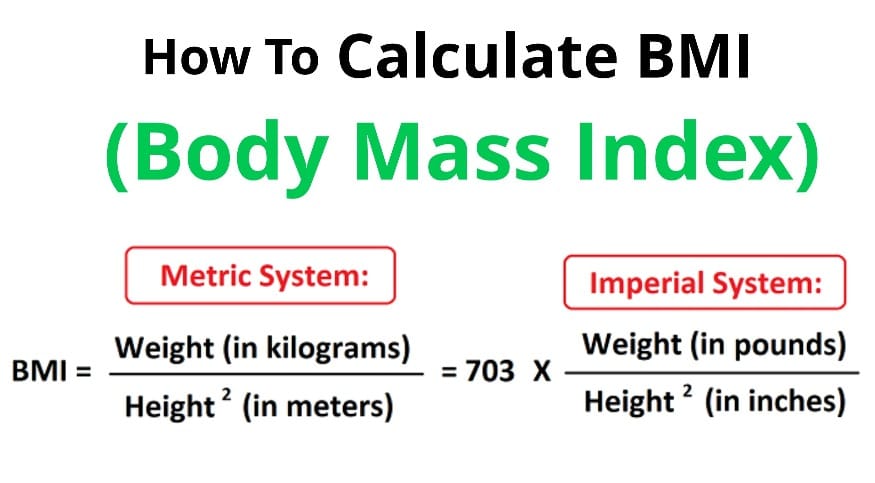
How to Calculate BMI
BMI = 70 ÷ (1.75 × 1.75)
BMI = 70 ÷ 3.0625
BMI = 22.86
BMI = (150 ÷ (65 × 65)) × 703
BMI = (150 ÷ 4225) × 703
BMI = 24.96
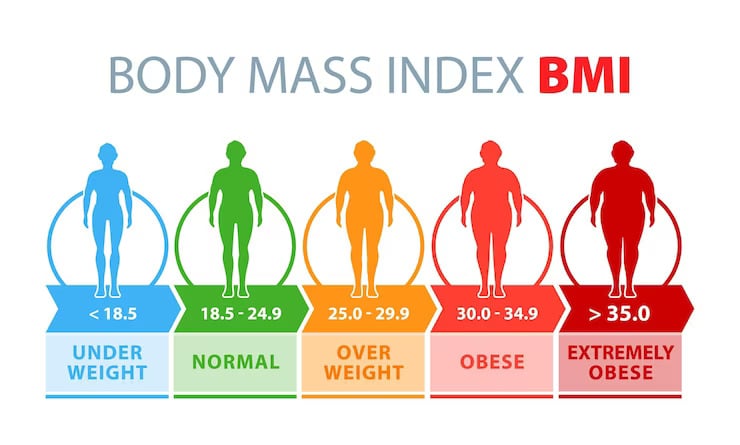
BMI Classification & Categories
The World Health Organization (WHO) and CDC use standardized BMI categories to assess health risks. These classifications are based on extensive research linking BMI values to disease risk and mortality rates (Nuttall, 2015).
| BMI Range | Classification | Disease Risk | Health Status |
|---|---|---|---|
| < 16.0 | Severely Underweight | Very High | Malnutrition risk |
| 16.0 – 18.4 | Underweight | Increased | Below healthy range |
| 18.5 – 24.9 | Healthy Weight | Low | Optimal range |
| 25.0 – 29.9 | Overweight | Increased | Above healthy range |
| 30.0 – 34.9 | Obese Class I | High | Obesity treatment advised |
| 35.0 – 39.9 | Obese Class II | Very High | Medical intervention needed |
| ≥ 40.0 | Obese Class III | Extremely High | Severe obesity |
Understanding Additional Metrics
BMI Prime
BMI Prime is calculated by dividing your BMI by 25 (the upper limit of healthy BMI). A BMI Prime of 1.0 indicates optimal weight, while values below 1.0 suggest underweight and above 1.0 indicate overweight.
Formula: BMI Prime = Your BMI ÷ 25
This metric provides a simple way to see how far you are from the ideal BMI threshold and is particularly useful for tracking progress over time.
Ponderal Index
The Ponderal Index (PI), also known as Rohrer’s Index, is an alternative measure that uses height cubed instead of squared. This makes it more accurate for very tall or short individuals where standard BMI may be misleading.
Formula: PI = Weight (kg) ÷ Height³ (m³)
Normal range for adults is 11-14 kg/m³. The Ponderal Index is particularly useful in pediatric medicine and for individuals at height extremes.
BMI for Special Populations
BMI for Children & Teens (Ages 2-20)
For children and teenagers, BMI is calculated the same way but interpreted differently using growth charts and percentiles that account for age and gender. The CDC provides specific BMI-for-age percentile charts:
• Underweight: Below 5th percentile
• Healthy Weight: 5th to 84th percentile
• Overweight: 85th to 94th percentile
• Obese: 95th percentile or above
Always consult your pediatrician for proper interpretation. View official charts: CDC Growth Chart for Boys | CDC Growth Chart for Girls
BMI for Athletes & Bodybuilders
BMI has significant limitations for athletes and individuals with high muscle mass. Since muscle weighs more than fat, athletic individuals may be classified as “overweight” or even “obese” despite having low body fat.
For athletes, consider alternative measurements:
• Body Fat Percentage (more accurate)
• Fat-Free Mass Index (FFMI)
• Waist-to-Hip Ratio
• Skinfold measurements or DEXA scans
BMI for Seniors (65+)
Research shows that slightly higher BMI may be healthier for older adults. The optimal BMI range for seniors (65+) is typically 23-28, rather than the standard 18.5-24.9.
This is because older adults experience natural changes in body composition, including decreased muscle mass and bone density. A study published in the American Journal of Clinical Nutrition found that BMI between 23-28 was associated with lower mortality in older adults (Winter et al., 2014).
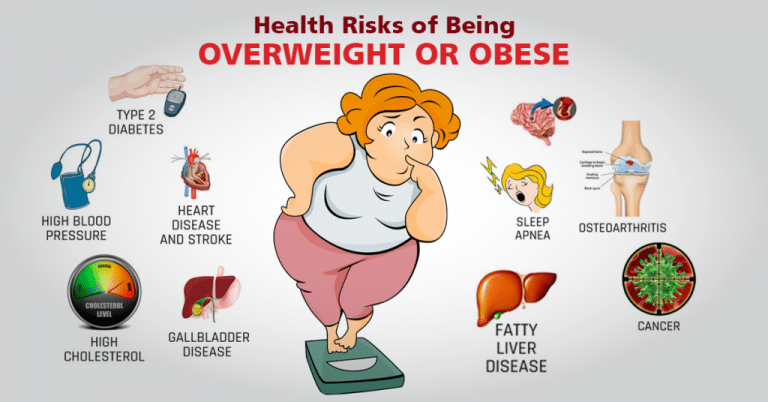
Health Risks of High BMI (Overweight/Obesity)
Being overweight or obese (BMI ≥ 25) significantly increases the risk of numerous health conditions. Research from the Harvard School of Public Health shows that as BMI increases, so does the risk of developing:
Cardiovascular Risks
• Heart Disease: 2-3× increased risk
• High Blood Pressure: 2-6× increased risk
• Stroke: Elevated blood clot formation
• High Cholesterol: Plaque buildup in arteries
Metabolic Disorders
• Type 2 Diabetes: 20-40× risk at BMI 30+ (Look AHEAD Trial)
• Metabolic Syndrome: Cluster of risk factors
• Fatty Liver Disease: Fat accumulation in liver
• Gallbladder Disease: Increased gallstone risk
Other Health Concerns
• Sleep Apnea: 10-30× risk at BMI 30+ (Research Study)
• Joint Pain & Arthritis: 4-5× risk (Hopkins Arthritis)
• Certain Cancers: 1.5-2× risk
• Respiratory Issues: Asthma, breathing difficulties
• Reproductive Problems: Infertility, PCOS
Health Risks of Low BMI (Underweight)
Being underweight (BMI < 18.5) can be just as concerning as being overweight. Low BMI may indicate malnutrition and is associated with several health risks:
Nutritional Deficiencies
• Protein, vitamin, and mineral deficiencies
• Weakened immune system
• Anemia (low iron)
• Poor wound healing
Physical Health Issues
• Osteoporosis and bone loss
• Muscle weakness and atrophy
• Fertility problems and irregular periods
• Impaired growth (children/teens)
Limitations of BMI
While BMI is a useful screening tool, it has important limitations that should be understood (Nuttall, 2015):
❌ Doesn’t Measure Body Composition
BMI cannot distinguish between muscle, fat, bone, and water weight. A muscular athlete may have a high BMI despite low body fat, while someone with low muscle mass may have a “healthy” BMI but high body fat percentage (sarcopenic obesity).
❌ Ignores Fat Distribution
BMI doesn’t account for where fat is stored. Visceral fat (around organs) is more dangerous than subcutaneous fat (under skin). Two people with the same BMI may have very different health risks based on fat distribution.
❌ Age & Gender Differences
BMI uses the same thresholds for all adults, but healthy body composition varies by age and gender. Women naturally have higher body fat percentages, and older adults may need slightly higher BMIs for optimal health.
❌ Ethnicity Variations
Different ethnic groups may have different body compositions at the same BMI. For example, Asian populations tend to have higher body fat percentages at lower BMIs, leading the WHO to recommend lower cutoffs (23 for overweight, 27.5 for obesity) for Asian populations.
Related Health & Fitness Calculators
Body Composition Tools
• Body Fat Percentage Calculator
• Fat-Free Mass Index (FFMI)
• Lean Body Mass Calculator
• Waist-to-Hip Ratio
• Ideal Weight Calculator
Calorie & Nutrition Tools
• TDEE Calculator
• BMR Calculator
• Macro Calculator
• Weight Loss Calorie Calculator
• Protein Intake Calculator
Fitness & Performance Tools
• One Rep Max Calculator
• VO₂ Max Calculator
• Workout Plan Generator
• Calories Burned Calculator
• Walking Calorie Calculator
Scientific References & Research
⚠️ Medical Disclaimer
This BMI calculator is provided for educational and informational purposes only. It is a screening tool, not a diagnostic instrument. BMI does not directly measure body fat percentage, muscle mass, or overall health status.
Always consult with qualified healthcare professionals, registered dietitians, or certified nutritionists before making significant changes to your diet, exercise routine, or lifestyle based on BMI results. This is especially important if you have pre-existing health conditions, are pregnant or breastfeeding, are taking medications, or have a history of eating disorders.
Individual health assessments should consider multiple factors beyond BMI, including family history, lifestyle, fitness level, body composition, and overall well-being. The calculations and recommendations provided are general guidelines and may not be appropriate for everyone.
Related
- Badminton Calories Burned Calculator
- Boxing Calories Burned Calculator
- Plank Calories Burned Calculator
- Burpee Calories Burned Calculator
- Crunches Calories Burned Calculator
- Sit-Up Calories Burned
- Zumba Calories Burned Calculator
- Pull Up Calories Burned Calculator
- Push-Up Calories Burned Calculator
- Home Activities Calories Burned Calculator
- Exercise Calories Burned Calculator
- Running Calorie Calculator
- Walking Calorie Burned Calculator
References
- Nuttall FQ. Body Mass Index: Obesity, BMI, and Health: A Critical Review. Nutr Today. 2015 May;50(3):117-128. doi: 10.1097/NT.0000000000000092. Epub 2015 Apr 7. PMID: 27340299; PMCID: PMC4890841.
- Khanna D, Peltzer C, Kahar P, Parmar MS. Body Mass Index (BMI): A Screening Tool Analysis. Cureus. 2022 Feb 11;14(2):e22119. doi: 10.7759/cureus.22119. PMID: 35308730; PMCID: PMC8920809.
- Nuttall, Frank Q. MD, PhD. Body Mass Index: Obesity, BMI, and Health. Nutrition Today 50(3):p 117-128, May/June 2015. | DOI: 10.1097/NT.0000000000000092
- https://www.cdc.gov/obesity/downloads/bmiforpactitioners.pdf
- Katherine M. Flegal, Brian K. Kit, Barry I. Graubard, Body Mass Index Categories in Observational Studies of Weight and Risk of Death, American Journal of Epidemiology, Volume 180, Issue 3, 1 August 2014, Pages 288–296.
- Edwards, C.H., Aas, E. & Kinge, J.M. Body mass index and lifetime healthcare utilization. BMC Health Serv Res 19, 696 (2019). https://doi.org/10.1186/s12913-019-4577-0

Manish is a NASM-certified fitness and nutrition coach with over 10 years of experience in weight lifting and fat loss fitness coaching. He specializes in gym-based training and has a lot of knowledge about exercise, lifting technique, biomechanics, and more.
Through “Fit Life Regime,” he generously shares the insights he’s gained over a decade in the field. His goal is to equip others with the knowledge to start their own fitness journey.
Really amazing content full of depth informative and detail content … just wow…well done