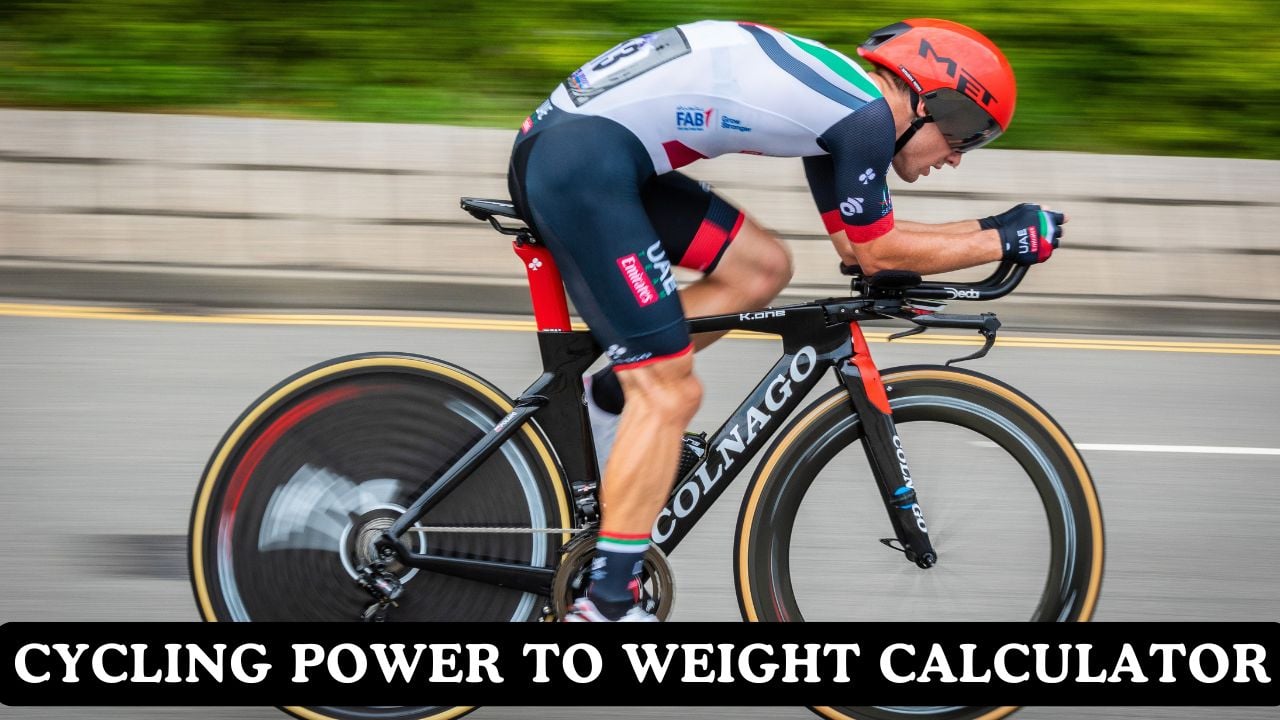
Cycling Power to Weight Calculator
What is Power-to-Weight Ratio?
Power-to-weight ratio (W/kg) measures your cycling power output divided by your body weight. This simple metric reveals your climbing ability and endurance performance better than power or weight alone.
Calculate it by dividing your Functional Threshold Power (FTP) by your body weight in kilograms. FTP is the maximum power you can sustain for approximately one hour during intense cycling.
Research shows W/kg strongly predicts climbing speed on gradients above 5%. While absolute power helps on flat roads, power-to-weight ratio becomes critical when climbing against gravity. Enhance your overall fitness with comprehensive exercise programs.
Why Power-to-Weight Ratio Matters
When climbing, you fight gravity with every pedal stroke. Your total system weight (rider + bike + gear) determines how much power you need to ascend at any given speed.
On gradients above 4-5%, gravitational resistance becomes the dominant force. This makes W/kg ratio more important than absolute power or aerodynamics for climbing performance.
Research confirms that W/kg reliably predicts climbing speed across different gradients and effort durations. Build supporting strength with leg strengthening exercises to improve your power output.
Performance Benchmarks
Tour de France winners sustain 6.4-7.0 W/kg during mountain stages. Elite professional cyclists maintain 5.6-6.4 W/kg, while competitive amateurs range from 3.2-4.8 W/kg depending on category.
Recreational cyclists typically measure 2.0-3.2 W/kg, and beginners often start below 2.0 W/kg. These benchmarks help you assess your current level and set realistic improvement goals.
Combine W/kg analysis with VO2 max testing for complete fitness assessment. Support your cycling with core strengthening exercises to improve stability and power transfer.
Calculation Examples
Example 1: Recreational Cyclist
Step 1: Calculate W/kg ratio
150W ÷ 60kg = 2.50 W/kg
Step 2: Determine category
2.50 W/kg falls in “Fair” range (2.0-3.2 W/kg for recreational cyclists)
Step 3: Calculate climbing speed
Total weight = 60kg + 8kg bike = 68kg
At 9.4 km/h: Gravity (139W) + Rolling (7W) + Air (5W) = 151W ✓
Result: 9.3-9.5 km/h on 8% gradient
This fitness level suits group rides and recreational cycling. Increase power through structured training programs to reach competitive levels.
Example 2: Competitive Racer (300W @ 70kg)
Input Data:
• Power Output (FTP): 300 watts
• Body Weight: 70 kg
• Gender: Male
• Discipline: Road Racing
Calculations:
• Power-to-Weight Ratio: 300W ÷ 70kg = 4.29 W/kg
• Performance Category: Very Good (Category 2-3 racing level: 4.0-4.8 W/kg)
• Climbing Speed on 8% Gradient:
– Total system weight: 70kg + 8kg bike = 78kg
– At ~4.0 m/s (14.4 km/h): Power required = 245W (gravity) + 12W (rolling) + 35W (air) ≈ 292W ✓
– Estimated climbing speed: 14.2-14.5 km/h
Interpretation: Strong competitive cyclist capable of racing at Category 2-3 level.
Performance suitable for regional races and strong club racing. Additional 20-30 watts would elevate to Category 1 level (4.8+ W/kg).
Example 3: Professional Climber (450W @ 66kg)
Input Data:
• Power Output (FTP): 450 watts
• Body Weight: 66 kg
• Gender: Male
• Discipline: Hill Climbing
Calculations:
• Power-to-Weight Ratio: 450W ÷ 66kg = 6.82 W/kg
• Performance Category: World Class (Grand Tour climber: 6.8+ W/kg)
• Climbing Speed on 8% Gradient:
– Total system weight: 66kg + 8kg bike = 74kg
– At ~6.3 m/s (22.7 km/h): Power required = 370W (gravity) + 18W (rolling) + 110W (air) ≈ 498W
– At ~5.8 m/s (20.9 km/h): Power required = 340W (gravity) + 17W (rolling) + 85W (air) ≈ 442W ✓
– Estimated climbing speed: 20.5-21.0 km/h
Interpretation: Elite professional climbing specialist comparable to Grand Tour podium contenders.
Performance matches Tour de France mountain stage winners (Pogačar, Vingegaard level). Represents the physiological ceiling
of sustainable climbing performance in professional cycling.
Calculation Formulas
Rolling = (Rider + Bike) × 9.81 × 0.004 × Speed
Air = 0.5 × 0.35 × 1.225 × Speed³
Elite (Pro Racer): 5.6-6.4 W/kg
Competitive (Cat 1-2): 4.8-5.6 W/kg
Club Racer (Cat 3): 4.0-4.8 W/kg
Recreational: 3.2-4.0 W/kg
Beginner: 2.0-3.2 W/kg
How Climbing Speed is Calculated
Three Forces You Must Overcome
1. Gravity: The main force on climbs. Calculated as (Rider + Bike) × 9.81 × Speed × Gradient. This increases with total system weight.
2. Rolling Resistance: Tire friction against the road. About 0.4% of your weight multiplied by speed. Smaller than gravity but still significant.
3. Air Resistance: Increases with speed cubed. Less important on climbs than on flats, but still requires power at higher speeds.
Our calculator solves these equations iteratively to find your actual climbing speed. Support climbing with leg strengthening workouts.
Why We Include Bike Weight
Many calculators ignore the 8 kg bicycle weight, overestimating speed by 15-25%. For a 60 kg rider, ignoring the bike means calculating with 60 kg instead of the actual 68 kg system weight.
This error matters more for lighter riders. At 50 kg body weight, the bike represents 14% of total system mass. Every kilogram saved directly improves climbing speed for the same power output.
This calculator uses complete physics with bike weight included, giving you realistic climbing estimates that match real-world performance. Optimize your training with our personalized workout planner.
Cycling Training Zones & Power Applications
| Training Zone | % of FTP | W/kg Range | Duration | Training Purpose |
|---|---|---|---|---|
| Active Recovery | ≤55% | ≤1.8 W/kg | 30-90 minutes | Recovery rides, warm-up, cool-down |
| Endurance | 56-75% | 1.8-2.4 W/kg | 1-6 hours | Aerobic base building, fat burning |
| Tempo | 76-90% | 2.4-2.9 W/kg | 20-60 minutes | Sustainable pace, lactate clearance |
| Lactate Threshold | 91-105% | 2.9-3.4 W/kg | 8-40 minutes | FTP improvement, race pace |
| VO2 Max | 106-120% | 3.4-3.8 W/kg | 3-8 minutes | Maximal aerobic power, climbing |
| Anaerobic | 121-150% | 3.8-4.8 W/kg | 30 seconds-3 minutes | Sprint power, short climbs |
Note: Training zones are based on Dr. Andrew Coggan’s Functional Threshold Power (FTP) model, widely used in cycling coaching. W/kg ranges shown assume an average recreational cyclist with 3.2 W/kg FTP and scale proportionally with individual fitness level. These zones represent intensity relative to FTP, which is the maximum power sustainable for approximately one hour.
How to Test Your FTP
Three Testing Methods
20-Minute Test (Most Popular):
Warm up for 15 minutes, then ride as hard as possible for 20 minutes. Your FTP = 95% of average power during the 20 minutes.
Ramp Test (Easiest):
Increase power by 10-20 watts every minute until you can’t continue. Your FTP = 75% of maximum power reached. Takes 15-20 minutes total.
60-Minute Test (Most Accurate):
Ride all-out for one hour. Your FTP = average power for the hour. Very demanding—most cyclists prefer 20-minute tests.
Build endurance for testing with cardio conditioning programs.
Testing Tips for Accurate Results
Before Testing: Rest for 48 hours. Calibrate your power meter. Eat normally and stay hydrated.
During Testing: Warm up for 15 minutes with 2-3 short efforts. Test indoors on a trainer for consistency (no wind, stops, or descents).
Testing Frequency: Test every 6-8 weeks during training. More often during intensive training blocks.
Important: FTP naturally varies ±3-5% based on fatigue, stress, and conditions. Track trends over time rather than obsessing over single tests. Enhance recovery with proven recovery strategies.
Power Measurement Methods & Technologies
| Power Meter Type | Measurement Location | Accuracy | Price Range | Best Application |
|---|---|---|---|---|
| Crank-based | Crank arm or spider | ±1-2% | $400-800 | Road cycling, consistent measurement |
| Pedal-based | Pedal spindle or body | ±1-2% | $500-1200 | Easy installation, bike switching |
| Hub-based | Rear wheel hub | ±1.5-3% | $300-600 | Training wheels, indoor cycling |
| Chain-based | Chain tension | ±2-3% | $200-400 | Budget option, retrofit existing bikes |
| Smart Trainers | Internal strain gauge | ±2-5% | $300-1500 | Indoor training, virtual racing |
Note: Power meter accuracy is crucial for reliable W/kg calculations. Regular calibration and consistent measurement conditions ensure optimal training data quality.
Frequently Asked Questions (FAQ)
What is a good power-to-weight ratio for cycling?
A “good” power-to-weight ratio depends on your goals and experience level. For recreational cyclists, 3.0-4.0 W/kg represents solid fitness. Competitive amateur racers typically range from 4.0-5.0 W/kg. Professional cyclists achieve 5.5-6.5+ W/kg, with Grand Tour winners sustaining 6.4-7.0 W/kg. For beginners, simply establishing a baseline and showing consistent improvement over months matters more than absolute numbers. Focus on progressive training and gradual increases rather than comparing yourself to elite athletes.
How accurate is the climbing speed estimate?
Our climbing speed calculation uses physics-based modeling that accounts for gravitational resistance, rolling resistance, air resistance, and total system weight (rider + 8kg bike). For the example of 150W power at 60kg body weight, the calculator estimates approximately 9.0-9.5 km/h on an 8% gradient, which aligns with real-world observations. Actual speeds vary ±10-15% based on altitude, temperature, wind, road surface, tire choice, riding position, and efficiency. The estimates assume sea level, 20°C temperature, calm conditions, and smooth pavement.
Should I lose weight to improve my W/kg ratio?
Weight optimization should prioritize health and sustainable body composition over pure performance. Reducing excess body fat can improve W/kg ratio without compromising power output, but extreme weight loss often reduces absolute power production and increases injury risk. The ideal approach combines strength training to maintain/build leg power with balanced nutrition to achieve healthy body composition. Consult sports nutritionists or physicians before significant weight changes. For many cyclists, focused training to increase FTP provides greater performance gains than weight reduction.
Why do female cyclists have lower W/kg benchmarks?
Physiological differences between sexes result in female performance benchmarks approximately 0.8-1.2 W/kg lower than male categories. These differences reflect variations in muscle mass distribution, hemoglobin concentration (affecting oxygen transport), body composition, and VO2 max capacity — all influenced by hormonal profiles. These are normal biological differences, not indicators of fitness level or training quality. Within their respective categories, female cyclists demonstrate identical training adaptations, competitive spirit, and performance improvements as male cyclists.
⚕️ Training & Performance Disclaimer
Consult with certified cycling coaches, sports scientists, or healthcare professionals before making significant training changes, especially if you have pre-existing health conditions, cardiovascular issues, injuries, or are taking medications that may affect exercise capacity. Always prioritize safety, proper warm-up protocols, gradual progression in training intensity, and adequate recovery.
References
- Leo, P., Spragg, J., Podlogar, T., Lawley, J. S., & Mujika, I. (2021). Power profiling and the power-duration relationship in cycling: A narrative review. European Journal of Applied Physiology, 122(2), 301. https://doi.org/10.1007/s00421-021-04833-y
- Sitko, Sebastian & Cirer-Sastre, Rafel & Corbi, Francisco & López, Isaac. (2020). Power Assessment in Road Cycling: A Narrative Review. Sustainability. 12. 5216. 10.3390/su12125216.

Manish is a NASM-certified fitness and nutrition coach with over 10 years of experience in weight lifting and fat loss fitness coaching. He specializes in gym-based training and has a lot of knowledge about exercise, lifting technique, biomechanics, and more.
Through “Fit Life Regime,” he generously shares the insights he’s gained over a decade in the field. His goal is to equip others with the knowledge to start their own fitness journey.